ABSTRAC
This study seeks to predict condominium prices in Malaysia by tackling the challenge of accurately assessing property values based on a range of features. The objective of this research is to create a model that can aid people in making well-informed decisions by identifying key variables influencing their prices by predicting the prices of condominium in Malaysia. A variety of techniques used in machine learning, such as linear regression and Gradient Boosting are used to construct predictive models. The findings reveal that Gradient Boosting (XGBoost) outperforms the others, it has the lowest error in matrixes such as Mean Squared Error, as well as the highest R-squared value showcasing the relevance of the features. The research concludes that the developed model is capable of accurately estimating property values, providing significant insights for the Malaysian real estate sector.
INTRODUCTION
The Malaysian property market, especially the condominium sector, has played a vital role in the nation’s economy. Condominiums, typically found in urban areas, offer contemporary homes for residents. Property prices in recent years are influenced by elements like urbanization, economic expansion, infrastructure upgrades, and market instability, have rendered it more difficult for stakeholders to evaluate property values precisely. Examining condominium pricing data is crucial to understand market movements, recognizing pricing patterns, and ensuring clarity for both buyers and sellers. This assessment is especially important in Malaysia, where economic diversity and regional differences greatly affect property valuations.
The forecasting of condominium prices has been an essential field of research in real estate economics and urban development. Current studies frequently emphasize many variables, including interest rates, inflation, and Gross Domestic Product (GDP), as indicators of housing prices. Although these studies offer a general viewpoint, they often neglect detailed, property-specific aspects like location, size, amenities, and closeness to services, which are crucial in establishing condominium prices.
Even with improvements in predictive modeling, a significant void exists in combining extensive datasets with local attributes to accurately forecast prices within the Malaysian framework. Moreover, the swiftly evolving urban environment, along with regional inequalities, makes it challenging to create precise and dependable pricing models. Filling this gap necessitates a detailed method that considers property-specific features, allowing for more accurate predictions. The condominium market in Malaysia lacks a robust, data-driven framework to predict property prices. Existing methods often fail to capture property features and external factors, leading to inaccurate valuations. This creates challenges for buyers in making informed decisions and sellers in setting competitive prices in ensuring housing affordability and market stability. The absence of reliable predictive models contributes to speculation and uneven price trends.
The primary objective of this research is to develop a model to estimate the prices of condominiums in Malaysia accurately based on property attributes and external factors. The goals include:
Data Exploration and Analysis: To identify key variables influencing condominium prices and uncover patterns and trends within the dataset.
Model Development: To build and validate machine learning models for price prediction using advanced feature selection and optimization techniques.
Comparative Analysis: To evaluate the effectiveness of different predictive approaches and identify the most suitable model to predict Malaysian condominium prices.
Practical Application
To provide insights for real estate stakeholders, aiding in decision-making and strategic planning.
This research holds significant real-world implications as accurate price predictions allow buyers to make informed decisions and assist sellers in setting competitive prices. Furthermore, the findings can contribute to housing economics in developing countries, offering a localized perspective on predictive modeling. By addressing existing the gaps and challenges, this study aims to create a robust framework to understand and predict condominium prices particularly in Malaysia.
LITERATURE REVIEW
Accurate predictions of condominium prices has attracted a lot of attention to people especially for real estate developers. Various studies have explored the application of data mining techniques to real estate markets, employing methods such as regression analysis, machine learning algorithms and many more. However, many studies face challenges including data availability, and model performance in varying market conditions. This review will compare and contrast key findings from recent literature, focusing on datasets, algorithms and evaluation metrics used in predicting property prices. Table 1 show the summary of all the literature we have collected so far.
| Authors & Year | Dataset Used | Features | Algorithm used | Evaluation Metrics | Additional Info |
|---|---|---|---|---|---|
| Zulkifley et al (YYYY) (Zulkifleyet al., 2020) | Proprietary dataset from various data set sources | Locational attributes,
Access to shopping mall Access to school Access to hospital Restaurant Public transportation structural attributes no of bedroom no of bathroom floor area garage and patio property age housing lot size neighborhood attributes socio economic variable local government crime rates place of worship pleasant landscapes quite atmosphere economic attributes income cost of material. |
ANN, Support Vector Regression. XGBoost. | – Root Mean Square Error (RMSE)
– RMSE values for these models were found to be the lowest when using locational attributes alone. |
– The study analyzed various attributes and their impact on house price prediction models
– The study highlighted the importance of locational attributes in predicting house prices, as they tend to yield lower RMSE values. |
| (A. C. C. Siang, 2023) | – Public dataset on Malaysian condos
– data sourced from Mudah.com |
Bedroom, Bathroom, Property Size, Nearby School, Nearby Mall, Ad list, Category, Facilities, Building Name, Developer, Tenure type, Address, No of Floors, Total Units, Property Type, Parking Lot, Floor range, Land Title, Firm Type, Firm Number, REN Number, Bus stop, Mall, Park, School, Hospital, price, Highway, Nearby Railway Station, Railway Station. | Decision Tree, Naïve Bayes, Support Vector Machine (SVM). | Mean Absolute Error (MAE), R-Squared, RMSE. | Analysis showed the importance of locational features and proximity to amenities to the price of condo. |
| (Mohd et al., 2019) | Proprietary dataset from Petaling Jaya area, Selangor, Malaysia | Selling price, Buying price, Floor, Transaction price/sqf, Green certificate, Main floor area, Number of bedrooms, Distance to CBD, Building category, Ownership, Category area, Area classification, Building classification, Age of the building, Seller | Random Forest Regressor, Decision Tree Regressor, Ridge, Linear Regression, Lasso | R-Squared, RMSE | The study focuses on predicting housing prices in Petaling Jaya using various machine learning algorithms. Random Forest Regressor showed the highest accuracy |
| (Yeeet al., 2021) | Publicly available dataset from Brickz (https://www.brickz.my/ | SPA Date, Address, Building Type, Tenure, Floors, Rooms, Land Area, Built-Up, Price PSF, Price, Month, Area, Tenure_f, Building Type_f | Decision Tree, Linear Regression, Random Forest | – Accuracy
– R-Squared – RMSE – MAE |
The study focuses on predicting residential property prices to address the property overhang issue in Malaysia. Random Forest model produced the highest accuracy with lower R2, RMSE, and MAE values |
| (Rahmanet al., 2021) | Publicly available dataset from Kaggle and Google Map | Location, Price, Rooms, Bathrooms, Property Type, Size, Furnishing, Distance to Shopping Mall, Distance to Hospital, Access to Public Transport, Distance to Nearest School. | LightGBM, XGBoost, Multiple Regression Analysis, Ridge Regression. | MAE, RMSE, Adjusted R-Squared. | XGBoost showed the highest performance with the lowest MAE and RMSE, and the closest adjusted R-squared value to one. |
| (Changet al., 2019) | Proprietary dataset from Jordan Lee and Jaafar (S) Sdn. Bhd. | Lot size, Tenure type, Time to expiry, Terrace type, Number of bedrooms, Building size, Distance to nearest shopping mall, Distance to nearest supermarket, Transaction date. | Multiple Unreplicated Linear Functional Relationship (MPULFR) Model, Multiple Linear Regression. | Mean Square Error (MSE), R-Sqaured. | The study focuses on predicting housing prices in Petaling district and its six sub-regions. The MPULFR model showed better fitting ability and prediction accuracy compared to the MR model. |
| (Masromet al., 2022) | Proprietary dataset from the valuation and property service department, Kuala Lumpur | Green Certificate, Level Property Unit, Building Floor, Date of Transaction, Distance, Age of Building, Type of Property, No of Bedroom, Security of Building, Mukim, Population Density, Lot Area, Main Floor Area. | Deep Learning, Decision Tree, Random Forest. | R-Squared, RMSE, Relative error. | The study focuses on predicting condominium prices with green building factors. RF showed the highest performance with 94% fitness and 12.6% relative error. |
| (Nur Shahirah Ja’afar et al., 2021) | Propriety dataset from Scopus and Web of Science | Location, Land Size, Number of Rooms, Property Type, Age of Property, Floor Area, Amenities, Proximity to Facilities, Neighbourhood Quality, Market Conditions, Historical Prices, Economic Indicators, Crime Rates
Transport Links, Environmental Factors, Building Condition, Renovation Status, Ownership Status, Property Tax, Rental Yield. |
Random Forest | R-Squared, RMSE, MAE, MSE | The study identified and screened relevant articles, focusing on those published between 1999 and 2021. |
| L. W and Jie, 2020) | Real estate data from Kuala Lumpur | Location, property size, number of bedrooms, number of bathrooms, proximity to amenities. | Linear Regression, Gradient Boosting, Neural Networks. | RMSE, Adjusted R-squared, MAE. | Neural Networks showed the highest accuracy in predicting real estate prices. |
| (M. A and Huda, 2019) | Property listings from Selangor | Location, property type, size, number of rooms, age of property, nearby facilities. | K-Nearest Neighbors (KNN), Random Forest, XGBoost. | MAE, RMSE, R-squared. | XGBoost outperformed other algorithms in terms of prediction accuracy. |
| M. S. N and Fauzi, 2020) | Property transaction data from Malaysia | Location, property type, size, number of rooms, age of property, amenities. | Support Vector Machine (SVM), Decision Tree, Random Forest. | MAE, RMSE, R-squared. | The study highlights the how effective Random Forest is in predicting housing prices. |
| M. F. Dziauddin, 2019) | 476 condominium sales in Kuala Lumpur between January 2017 and June 2018 | Proximity to transit station, floor area, freehold ownership, gymnasium, swimming pool, tennis court, jogging track, distance to primary school, distance to secondary school, distance to shopping mall, distance to central business district, distance to recreational area. | Hedonic Pricing Model. | Adjusted R², T-value, Variance Inflation Factor (VIF). | The study found that being close to transit stations significantly increases condominium prices by up to 30%. |
| (A. Y. S. A. R. and Abdullah, 2024) | 531 samples of transacted condominium units from Georgetown, Penang (2020-2023) | number of bedrooms, number of bathrooms, building age, total number of levels, existence of facilities (swimming pool, gym, playground, lift, guarded compound), type of tenure, number of public transportation stations, police stations, educational facilities, hospitals, proximity to natural forest, proximity to shoreline, view of natural forest, view of shoreline. | Ordinary Least Squares (OLS) regression. | R-squared, T-value, Variance Inflation Factor (VIF). | The study found that proximity to natural forests significantly increases condominium prices, while proximity to shorelines does not have a significant impact. |
| (R. Fazilah, 2019) | Macroeconomic data from 2007 to 2017 collected from National Property and Information Centre (NAPIC) and Department of Statistics Malaysia (DOSM) | MHPI, GDP, BLR, CPI, population size, PCI, CBI, housing demand rate, housing stock index, world borrowing cost, outflows of foreign capital, subprime crisis, population characteristics, migration, urbanization, stamp duty exemption, moratorium, RPGT, location and accessibility, basic and public facility, financial loan, location and placement, credit facility, construction cost, development approval, price and rental, housing stock. | Multiple Regression Analysis (MRA). | R², T-value, Variance Inflation Factor (VIF). | The study aims to develop a model to predict housing supply based on macroeconomic and microeconomic factors. |
| (Ganeson, 2024) | An Analysis of the Factors Affecting House Prices in Malaysia – An Econometric Approach | Gross Domestic Product (GDP), Population, Inflation Rate and Unemployment Rate. | Multiple Regressions. | R-squared. | The study was able to find which of the factors were significantly related to the housing prices in Malaysia. |
| (Yee, 2024) | Using Machine Learning to Forecast Residential Property Prices in Overcoming the Property Overhang Issue | The area, number of rooms, and transaction details. | Decision Tree, Random Forests, Linear Regression. | RMSE, R-squared. | This aims to predict the price of property using different methods along with what factors contribute to it. |
| (Rahman, 2024) | Advanced Machine Learning Algorithms for House Price Prediction: Case Study in Kuala Lumpur | Location, property type, number of bedrooms and bathrooms, size and proximity to amenities such as schools and public transport. | Neural Networks, Gradient Boosting. | RMSE, R-squared, MAE. | During this study, with the two ML models used which were LightGBM and XGBoost it is found that XGBoost was the most promising in-terms of prediction. |
| (Mohd, 2024) | Machine Learning Housing Price Prediction in Petaling Jaya, Selangor, Malaysia | Location, number of bedroom and bathrooms, property type, built-up area, nearby amenities. | Decision Tree, Random Forest, Multiple Linear Regression. | RMSE, R-squared. | This research was done based of housing prices in Petaling Jaya and it used machine learning to be able to accurately predict the prices. |
| (Yee, 2024) | Using Machine Learning to Forecast Residential Property Prices in Overcoming the Property Overhang Issue | Location, Property Attributes, Economic Indicators, Environmental Factors. | Decision Tree, Linear Regression, Random Forest. | R-Squared, RMSE, MAE. | It was found that Random Forest model produced highest accuracy with a lowered R-squared, RMSE, and MAE values. |
| (Yah, 2024) | Machine Learning: Prediction of House Prices in Malaysia | Property Type, Property Size, Number of Bedrooms and Bathrooms, Facilities, Parking Lots, Land Type and Tenure Type. | Linear Regression. | MAE, R-squared. | The use of MAE and R-squared were to see how far off their predictions were within the study. |
Dataset Description
This dataset comprises raw Malaysian housing prices data, highly relevant for addressing housing affordability, regional disparities, and real estate trends within Malaysia from Mudah.my (Chan, 2025). Housing data is critical in urban planning, economic analysis, and policymaking. By analysing housing prices and their determinants, stakeholders can gain insights into market dynamics, identify trends, and create predictive models to inform decisions.
The dataset’s enables a comprehensive understanding of condominium price determinants, including location, property type, and amenities. The data provides a perspective on the Malaysian housing market, a vital aspect of the nation’s socioeconomic framework.
The Exploratory Data Analysis (EDA) conducted aimed to uncover patterns, trends, and anomalies within the dataset. Key trends identified include regional price disparities, urban areas like Kuala Lumpur show significantly higher average housing prices, as well as larger properties are generally higher prices. The analysis also highlighted outliers, with high-end properties such as luxury bungalows exhibiting extreme price outliers, which skews the price distribution. Additionally, several listings show anomalously low prices, potentially due to incomplete records or distress sales.
These findings were visualized through graphical representation, the histograms reveal the skew in price distributions, the boxplots are used to outline outliers in prices across regions and property types, and a correlation heatmap showed strong correlations between price, size, and location features.
SimpleImputer (Mean Imputation) to handle missing values, where missing values in numerical columns were filled with the mean of their respective columns. In cases where an entire column, like Property Size, was missing, zero was used as the value to ensure all columns remained usable in subsequent analyses.
Data type conversion was then performed to convert columns to numeric types using the pd.to_numeric function to guarantee compatibility with machine learning algorithms and prevent issues from inconsistent or incompatible data types. The dataset was then separated into features (X), which are the predictive variables used for modeling, and the target variable (y), which is the outcome variable to be predicted, such as price. This division ensures the dataset was ready for modeling tasks. Finally, to evaluate model performance effectively, the dataset is divided into training and testing subsets using the train_test_split function.
The program uses Recursive Feature Elimination (RFE), correlation matrix and manual selection to do feature selection for the data models. Recursive Feature Elimination (RFE) removes the least important features based on the model’s performance until the optimal subset of features is achieved which helps in identifying the most significant predictors for the model. The RFE has found bedroom, bathroom, property size, completion year and number of floors to have the most important features
Correlation Matrix Analysis was also used to calculate the correlation coefficients between all pairs of features. By examining the correlation matrix, highly correlated features can be identified and removed to avoid multicollinearity, ensuring that the model is not biased by redundant information.
Manual Selection are also used to select features that are believed to be most relevant to the prediction task. This method allows for the inclusion of features that may not be statistically significant but are known to have practical importance.
METHODOLOGY
In this study we have chosen five algorithms to predict condominium prices in Malaysia. Each algorithm was carefully chosen based on important factors such as its suitability for the dataset, problem type, and relevance from prior studies. The algorithm is as follow:
Linear Regression
Linear Regression is a fundamental algorithm suitable for continuous data (https://www.geeksforgeeks.org/ml-linear-regression/). Given the structured nature of the dataset which contain features like size, location, and amenities, Linear Regression offers simplicity and interpretability. Its especially useful for smaller dataset where the relationship between independent variables (features) and the target variables (price) is linear (https://www.geeksforgeeks.org/ml-linear-regression/).
Linear Regression models the relationship between the target variable y (price) and one or more independent variables x (features) as a straight line. The equation for a simple linear regression is expressed as (https://www.geeksforgeeks.org/ml-linear-regression/):
y is the target variable. X is the independent variable, β0 is the intercept, β1 is the slope. But in our case we are dealing with more than one independent variables. The equation will be:
β0 is the intercept. β1, β2, … are the coefficients showing the contribution of each feature. ϵ is the error term.
This algorithm minimizes the error (sum of squared differences) between actual and predicted values to find the optimal coefficients.
Decision Trees
Decision Trees are versatile and handle both categorical and continuous data. They are particularly effective for understanding the impact of locational and structural features, as demonstrated in the literature. Decision Trees are interpretable and work well on datasets with non-linear relationships.
A decision tree splits the data into subsets based on feature values to minimize impurity. For classification problems, impurity is measured using Gini Index or Entropy (https://www.geeksforgeeks.org/decision-tree/).
Gini Index
Where pi is the probability of class i.
Entropy
Entropy quantifies the disorder of a dataset. A split that reduces entropy the most is chosen (https://www.geeksforgeeks.org/decision-tree/).
The same tree-generation algorithm can be used for regression for example numerical and continuous valued target. But instead of Gini impurity, variance of the node is calculated to identify the effectiveness of a split.
The predicted value of the decision path is the mean of the data point in the leaf node.
Random Forest
Random forest is an ensemble method that combine multiple decision trees to improve prediction and reduce overfitting (https://www.geeksforgeeks.org/random-forest-algorithm-in-machine-learning/). Its ability to handle large feature sets and identify important predictor makes it suitable for a dataset with a mix of locational, structural and economic attributes found in this study.
The Random Forest algorithm work by assembling multiple decision tree. Each tree specializes in different aspect of the data. This thanks to two key mechanisms which is random feature selection, where it ensure that each tree focus on a unique subset of features, and bootstrap aggregating (bagging), where multiple subset of the dataset are created through sampling with replacement (https://www.geeksforgeeks.org/random-forest-algorithm-in-machine-learning/). These strategies introduce variety among the tress, thus reducing the models sensitivity to any single dataset. For predictions, random forest use an internal voting mechanism while in classification task, the majority prediction across trees is chosen, while in regression task, the average prediction is used. This approach makes Random Forest highly effective and resilient (https://www.geeksforgeeks.org/random-forest-algorithm-in-machine-learning/).
Gradient Boosting (XGBoost)
Gradient Boosting is a powerful ensemble learning algorithm well-suited for regression tasks like predicting condominium prices. It works effectively with datasets that have complex, non-linear relationships between features and the target variable. XGBoost, an optimized implementation of Gradient Boosting, is particularly favored for its efficiency, scalability, and ability to reduce overfitting through advanced regularization techniques (https://www.geeksforgeeks.org/ml-gradient-boosting/).
Gradient Boosting builds a model iteratively by training each new tree to minimize the errors (residuals) of the previous tree. Initially, the first tree predicts the target variable, and its errors are calculated. These residuals are then used as the target for the next tree. This process continues, with each tree learning to correct the mistakes of the prior ones. The final prediction is the sum of all tree predictions, adjusted by a learning rate that controls the contribution of each tree (https://www.geeksforgeeks.org/ml-gradient-boosting/).
XGBoost enhances Gradient Boosting by incorporating techniques such as regularization to prevent overfitting, efficient handling of missing data, and parallel processing for faster computations. Its learning rate (shrinkage) helps balance model complexity and performance by scaling each tree’s contribution. This combination of features makes XGBoost a robust and reliable choice for accurate predictions in real-world datasets (https://www.geeksforgeeks.org/ml-gradient-boosting/).
Support Vector Regression (SVR)
Support Vector Regression (SVR) is a robust algorithm for regression tasks, particularly when the dataset includes complex, non-linear relationships (Sethi, 2024). It is well-suited for this project as it can model the relationship between condominium prices (a continuous target variable) and features like size, location, and proximity to amenities. SVR’s flexibility in handling non-linearity through kernel functions and its robustness to outliers make it effective for capturing intricate patterns in real estate data.
SVR extends the principles of Support Vector Machines (SVM) to regression tasks. Instead of minimizing the prediction error, SVR works within a margin of tolerance (ϵ) (Sethi, 2024). where predictions are considered acceptable. This allows the model to focus on accurately predicting points that lie outside this margin while ignoring minor deviations.
To handle non-linear relationships, SVR employs kernel functions that transform the input features into higher-dimensional spaces where linear relationships can be established (Sethi, 2024). Common kernel functions include:
Linear kernel: For datasets with nearly linear relationships.
Polynomial kernel: For modeling polynomial relationships of varying degrees.
Radial Basis Function Kernel: For datasets with highly complex, non-linear patterns, such as real estate prices influenced by diverse attributes.
Evaluation Indices
To asses the performance of the models used in predicting condominium prices we need to choose use some metric to evaluate it. After careful research and discussion, the metrics below has been chosen. These metrics were chosen based on their ability and relevance to the problem nature and dataset.
Mean Absolute Error (MAE)
The MAE is a metric that quantifies the average size of errors between the predicted and actual values, regardless of whether the error is positive or negative (Ahmed, 2024). It is determined by taking the mean of the absolute difference between the predicted values (ŷ) and the actual outcome (y):
MAE provides a straightforward interpretation of error in the same units as the target variable. It is less sensitive to outliers compared to other metrics (Ahmed, 2024) making it suitable for dataset where extreme error are less critical.
Root Mean Squared Error (RMSE)
RMSE is the square root of the average squared difference between predicted and actual values (https://www.geeksforgeeks.org/step-by-step-guide-to-calculating-rmse-using-scikit-learn/). The formula is as follows:
RMSE penalize larger errors more heavily due to squaring differences, making it ideal for identifying models that avoid significant deviations. This metrics is particularly useful when the impact of large errors on model evaluation needs to be minimized. Since RMSE is in the same units as the target variable it is easy to interpret in practical term (https://www.geeksforgeeks.org/step-by-step-guide-to-calculating-rmse-using-scikit-learn/).
R-Squared (R2)
R-squared measure the proportion of variance in the target variable that is explained by the model. It ranges from 0 to 1 which the higher the value the better the explanatory power (Onose, 2024). It is calculated as:
Where Sum of Squared Error (SSE) and Total Sum of Squares is compared (Onose, 2024). R-Squared provide a good way to measure how well the model capture variability in the target variable (Onose, 2024). It is really useful in comparing the performance of different model which can help identify which feature input explain the price variations.
Adjusted R-Squared
Adjusted R2 modifies R2 by accounting for the number of predictors in the model (Ouko, 2024). unlike R2, which can increase with the addition of irrelevant features, adjusted R2 penalize excessive use of features, providing a more accurate measure of model performance (Ouko, 2024). The calculation is as follows:
Where n is the number of observations and k is the number of predictors. For dataset with multiple features, adjusted R2 ensures that only meaningful predictors contribute to the performance evaluation, making it important for model with tons of features.
Model Development
In this study, we were tasked to develop a model to be able to analyze our dataset. Our dataset is based on what contributes to the price of houses. With that we developed a model to be able to predict the house prices. With that, several factors contributed to this model development which are the training and testing process, hyperparameter tuning, the libraries and tools used, and other factors which helped contribute to the development of our model.
Training and Testing Process
During this training and testing process, we ensured that every step was well planned to ensure that the workflow is smooth and with lesser amount of complications. Some of the steps consist of data preprocessing and cleaning, train-test split, model training and evaluation, and lastly feature selection.
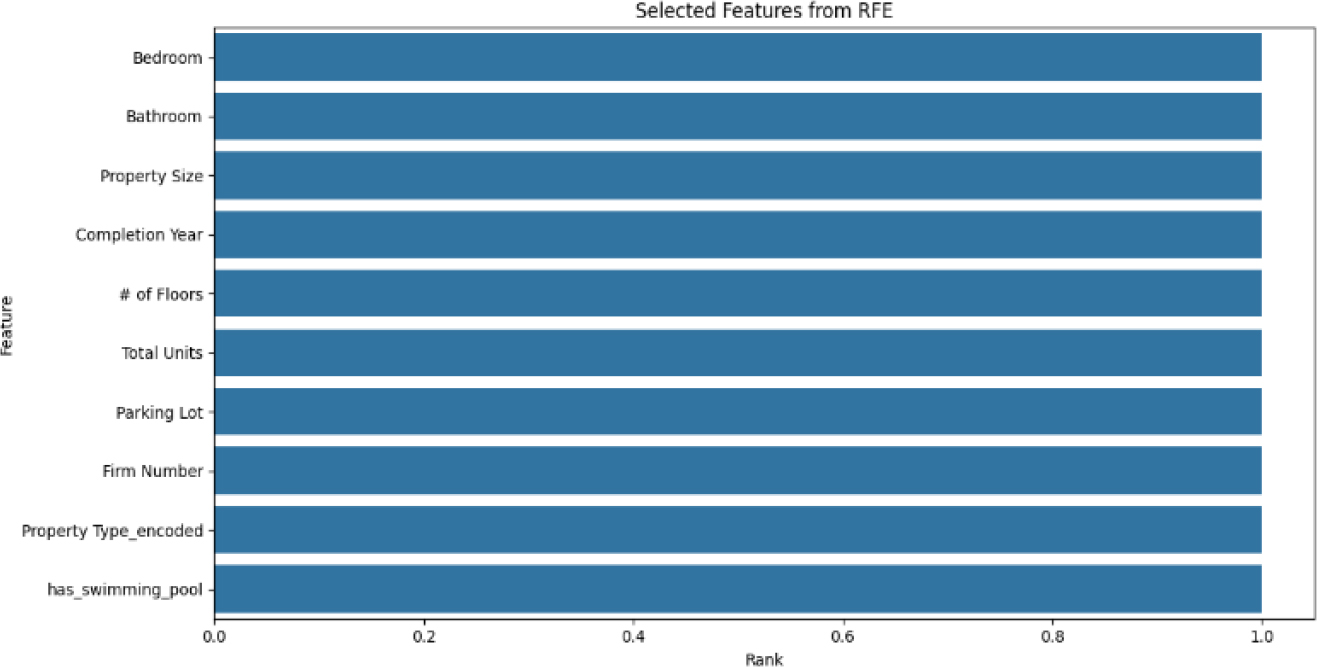
Figure 1:
Feature Selection through RFE.
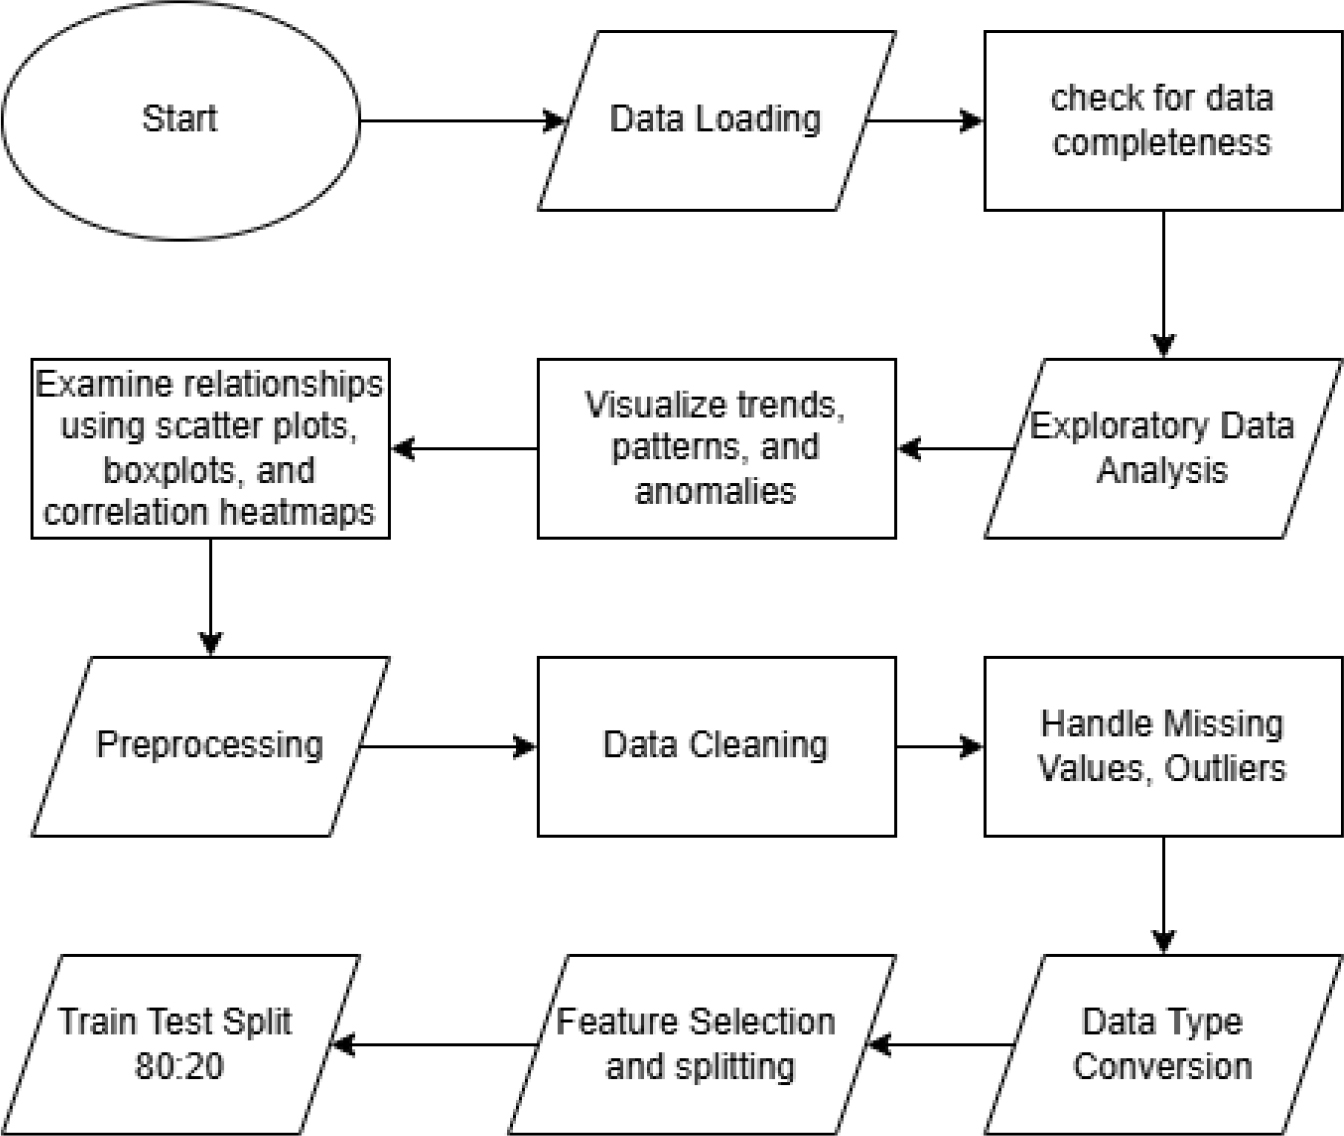
Figure 2:
Flowchart of project.
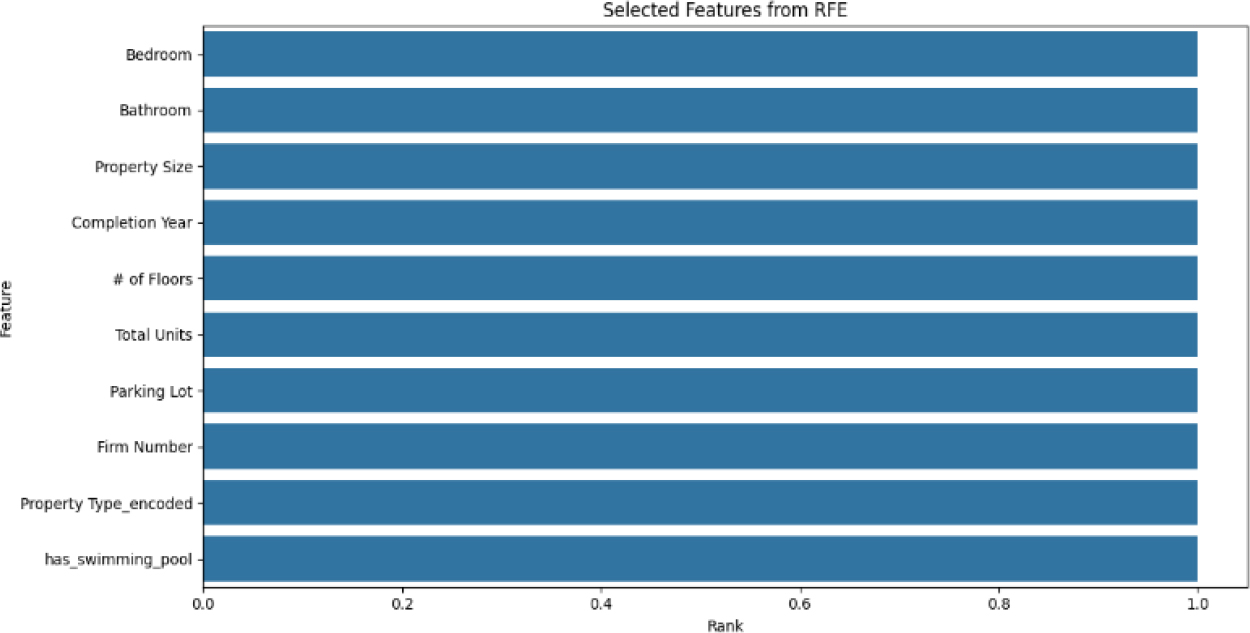
Figure 3:
Selected Features based on RFE.
Data Preprocessing and Cleaning
It is important that this step is followed during the training and testing process. This is because this step helps with certain factors such as cleaning certain parts of the data such as in the price column within the dataset. The price column was cleaned by removing strings such as ‘RM’, commas and unnecessary spaces between the values. In other words, this part helps with handling any mission or non-numerical values. Any missing values within the dataset will be represented as NaN.
This section also has feature engineering. Feature engineering is a technique which transforms raw data into a format that helps with the improvement of performance for machine learning models (J. M, 2025). This implements the use of binary features which can help capture if any facilities or amenities are present as this can affect the pricing of the houses. This is something important as it can directly affect the price of the house.
Lastly, we also used categorical encoding. What that is it converts categorical variables into numeric features which helps machine learning algorithms to interpret and handle categorical data (https://feature-engine.trainindata.com/en/1.7.x/user_guide/encoding/). This is encoded using the LabelEncoder in the code to be able to achieve this.
Train-Test Split
It is important that we are able to split the dataset into a training and testing subset. This is so that we can get an unbiased evaluation of a certain model’s performance (https://feature-engine.trainindata.com/en/1.7.x/user_guide/encoding/). This can be seen by the function train_test_split. For this model, we applied an 80:20 ratio where 80% is for training and 20% is for testing. This is to ensure that the model is trained on the majority of the data whereas the remaining 20% can help with evaluating the model’s generalization capabilities. This also helps prevent any biased evaluation, and not only that if the data percentage was higher such as 30% there could be potential risks of overfitting when training the model and if it’s too low it could provide insufficient data to evaluate the models performance.
Model Training and Evaluation
For the model development, there are five models in total we evaluated which consists of Linear Regression, Decision Tree Regressor, Random Forest Regressor, Gradient Boosting (XGBOOST), and Support Vector Regression (SVR). All these models were able to be fitted in the training data by the function fit () whereas predictions are made on the test data using function y_pred. Apart from that, we used different metrics to be able to measure its performance. The metrics used are Mean Absolute Error (MAE), Root Mean Squared Error (RMSE), R-squared, and Adjusted R-squared. For the Mean Absolute Error, and Root Mean Squared Error it is used to represent any existing errors in the model where the lower the value is the better the performance. As for R-squared, it is able to see how much of the variance in-regards to the house price is explained by the features. Lastly for the Adjusted R-squared it is used to help limit the number of features used to prevent any overfitting which can occur when many features are included.
Feature Selection
In feature selection, we used different methods to be able to select the most important features rather than all of them to help prevent overfitting. The feature selection methods that were used are Recursive Feature Elimination (RFE), Correlation Analysis, and Manual Feature Selection. For Recursive Feature Elimination (RFE) it a machine learning algorithm which helps by slowly removing unimportant features from a model to help optimize the performance of the model (https://www.scikit-yb.org/en/latest/api/model_selection/rfecv). This was the main feature selection model for the model, and it also helps rank the features based on how important they are. Next is the correlation matrix. This is used to be combined with the RFE to help with the understanding of the relationship between the features and our target variable. Lastly is the manual selection. Manual selection allows us to explicitly pick which columns are considered relevant manually. This is to ensure that the columns selected can have a direct contribution to the models performance.
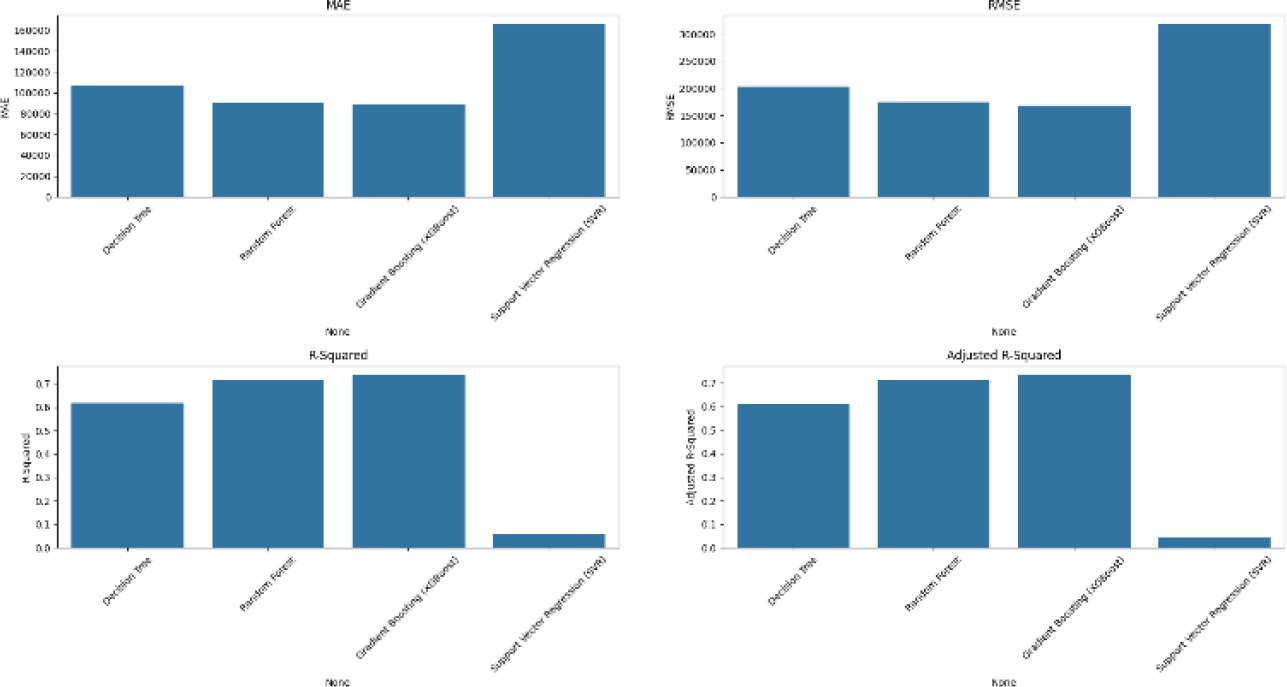
Figure 4:
Metric performance for all evaluation models.
| Feature | Abbreviation | Description | Type | Measurement Unit | Relevance |
|---|---|---|---|---|---|
| Category | CTGRY | The category of the listing (e.g., Apartment, Condominium) | Continuous | none | Indicates the general classification of the property, influencing demand and pricing. |
| Facilities | FAC | List of facilities available (e.g., pool, gym, security) | Categorical | none | Adds value based on the convenience and amenities offered. |
| Building Name | BN | Name of the property’s building | Categorical | none | Useful for branding and identifying high-demand buildings or projects. |
| Address | ADD | The full address of the property | Categorical | none | Essential for location analysis and mapping proximity to amenities or infrastructure. |
| Completion Year | CY | The year the property was completed | Continuous | Count | Indicates the property’s age, which may impact pricing and maintenance costs. |
| # of Floors | NF | Number of floors in the building | Continuous | Count | Reflects the scale and possible amenities of the building. |
| Total Units | TU | Total number of units in the building | Continuous | Count | Affects density and exclusivity, influencing property value. |
| Property Type | PT | Specific type of property (e.g., Studio, Duplex) | Categorical | none | Determines functionality and pricing based on buyer preferences. |
| Bedroom | BED | Number of bedrooms available in the property | Continuous | Count | Reflects property size and family suitability, significantly impacting price. |
| Bathroom | BATH | Number of bathrooms in the property | Continuous | Count | Influences pricing, especially in high-end properties. |
| Parking Lot | PL | Number of parking spaces included | Continuous | Count | Adds convenience and value, especially in urban areas. |
| Floor Range | FR | Range of floors where the unit is located (e.g., 1-10, 11-20) | Continuous | Count | Higher floors may command premium pricing due to better views and reduced noise. |
| Property Size | PS | The built-up area of the property | Continuous | Square Feet (sq. ft.) | Key determinant of property value. |
| Land Title | LT | Type of land title (e.g., Bumi, non-Bumi) | Categorical | none | Indicated whether the land is Bumi or non-Bumi. |
| Firm Type | FT | Type of firm managing the property | Categorical | none | The type of firm who posted the listing. |
| price | PRICE | Final listing price of the property | Continuous | Malaysian Ringgit (MYR) | Target variable for predictive modeling. |
| Nearby School | NSCL | nearby schools | Categorical | none | Important for families with children. |
| Park | PARK | Nearest park | Categorical | none | Enhances quality of life and recreational opportunities. |
| Nearby Railway Station | NRS | Nearest Railway station | Categorical | none | Enhances accessibility and convenience. |
| Bus Stop | BUS | Nearest Bus stop | Categorical | none | Indicates ease of public transport access. |
| Nearby Mall/Mall | NMAL | Nearest Mall | Categorical | none | Indicates convenience and access to retail, influencing property desirability. |
| Highway | HWAY | Nearest Highway | Categorical | none | Enhances connectivity and reduces commute times, adding value to properties. |

Figure 5:
Best parameters for Decision Tree.

Figure 6:
Best parameters for Random Forest.
Hyperparameter Tuning
For hyperparameter tuning it is used to help optimize the model’s hyperparameter for improved performance which can be crucial to refining our model. The hyperparameter tuning we’re using is the Grid Search. Grid Search is an algorithm which is used in machine learning for hyperparameter tuning and it will exhaustively try every combination of the values to help find the best model (https://www.dremio.com/wiki/grid-search/). This will help in testing all the combinations of a predefined set of hyperparameters. This can be used in areas such as Random Forest where it can help with searching different values for the number of trees and the maximum depth of trees. In other words, Grid Search also helps with automating hyperparameter searches. This saves time in-comparison to manually selecting hyperparameters which will help in boost the performance of our model. In conclusion, Grid Search is a powerful technique which provides an exhaustive search throughout all the hyperparameter combinations in the specified grids, and although it can be considered computationally expensive, it will ensure the finding of the best configuration for the model.
Libraries and Tools Used
The model was made via Python. With that being said, there are several libraries and tools that were used to be able to make the model development a success. The first is Pandas. Pandas was used in our code for the purpose of data manipulation and cleaning. Pandas helps by providing data structures such as DataFrames which is good at handling tabular data. It is mainly used to help read the dataset. Not only that, but it also helped with preprocessing the features, and cleaning the data as well.
Apart from Pandas, NumPy was also used in the development of our model. NumPy is a library to help with numerical computations within Python. In other words, NumPy can be used to help with deal with arrays and mathematical operations. Not only that, but it also helps with the handling of NaN values.
Next is the Scikit-learn or also known as sklearn. This was an important library used to help with model development. It helps by providing tools for purposes such as model training, splitting datasets, evaluating performance and even with performing feature selection. The main usage of this library is to handle tasks such as model fitting, making model predictions, calculating performances for metrics such as MAE, RMSE, R-squared and Adjusted R-squared, and it also helps with scaling the features.
Lastly is XGBoost. This is used to create powerful and efficient tree-based models. The main usage of XGBoost is to fit gradient boosting models. This is known to be able to perform well for structured data. Although these were the main libraries and tools used, there are others such as SimpleImputer, LabelEncoder, and RFE. SimpleImputer is used to handle missing values by imputing them with the mean of the column, LabelEncoder is used to encode categorical variables into numerical labels, and RFE, Correlation Matrix, and Manual Selection is used to select features for our model.
RESULTS AND DISCUSSION
For the result and discussion, we will be summarising the performances based off the regression models we used to predict the pricing of the houses. This will include the Decision Tree, Random Forest, Gradient Boosting (XGBoost), and Support Vector Regression (SVR). All of these results are based off different performance metrics that were used in the development of this model such as Mean Absolute Error (MAE), Root Mean Squared Error (RMSE), R-squared, and Adjusted R-squared.
Model Training and Testing Performance
For the model training we had to ensure that the dataset had to be preprocessed and cleaned to be able to handle any inconsistencies such as values that are missing, encoding categorical features, and scaling for the numerical features. By applying our feature selection methods such as RFE, Correlation Matrix and Manual Selection, we selected only the relevant features for the model as seen from the figures above, and the data was split into an 80:20 ratio. We also used the Grid Search technique with cross-validation to perform optimization for the hyperparameters for each model.
As seen from Table 3 and the figure above, Gradient Boosting (XGBoost) is the best performing as it has the lowest MAE and RMSE values along with the highest R-squared and Adjusted R-squared values. In terms of the highest error, Support Vector Regression has the highest in-terms of MAE and RMSE values.
| Dataset | Percentage (%) |
|---|---|
| Training set | 80 |
| Testing set | 20 |
| Model | MAE | RMSE | R-Squared | Adj. R-Squared |
|---|---|---|---|---|
| Decision Tree | 106945.56 | 203856.57 | 0.62 | 0.61 |
| Random Forest | 90492.92 | 175307.70 | 0.72 | 0.71 |
| Gradient Boosting (XGBOOST) | 88658.45 | 167890.12 | 0.74 | 0.74 |
| Support Vector Regression (SVR) | 166390.39 | 319270.51 | 0.06 | 0.05 |
Based on these results, models such as Gradient Boosting (XGBoost) is better suited for predicting house prices because of their ability to model complex relationships between features and the target variable.
Model Comparison and Discussion of Overfitting/Under fitting
To be able to have a better understanding of the model ability it is important to assess their performance in terms of both the training and testing sets. The models were properly evaluated using the hyperparameter tuning which helped with reducing the risk of overfitting by ensuring that the models are not overly complex or tailored to specific subsets of data.
For overfitting data, the model has performed well to prevent this from occurring, but it isn’t as efficient when it comes to generalizing unseen data. This was less of an issue as the models showed consistent performances between training and test sets. This can be seen from the performance of the Gradient Boosting (XGBoost) which had good results from both the training and testing sets.

Figure 7:
Best parameters for Gradient Boosting (XGBoost).

Figure 8:
Best parameters for Support Vector Regression (SVR).
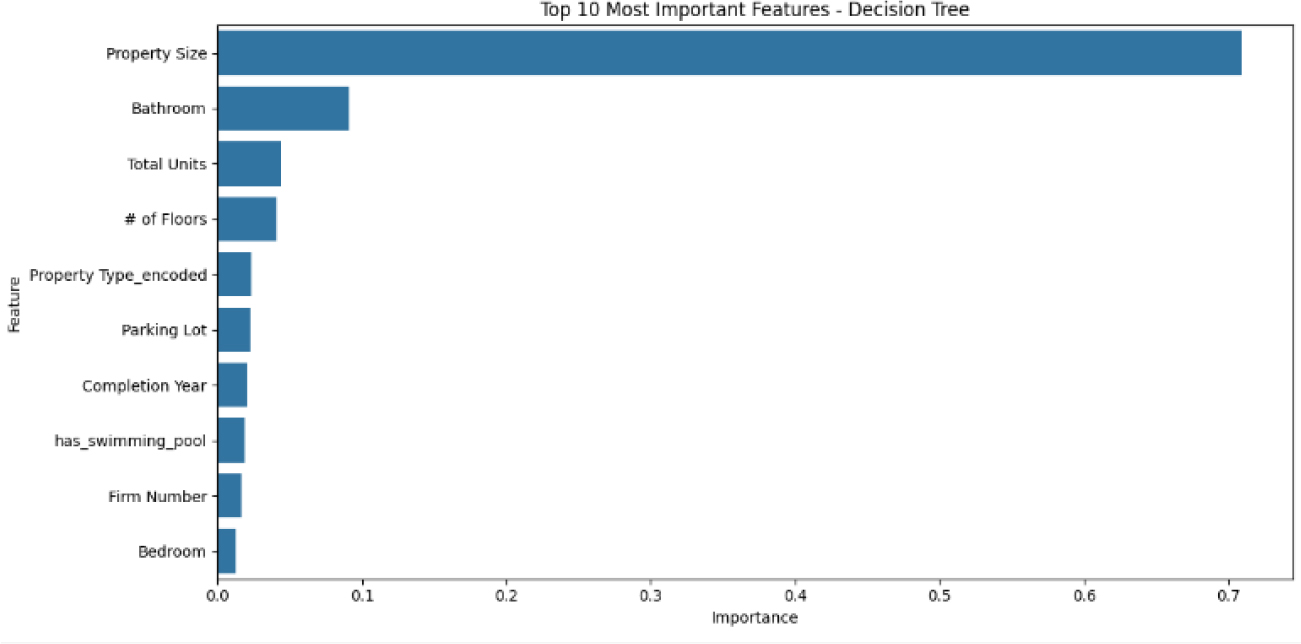
Figure 9:
Most important features for Decision Tree.
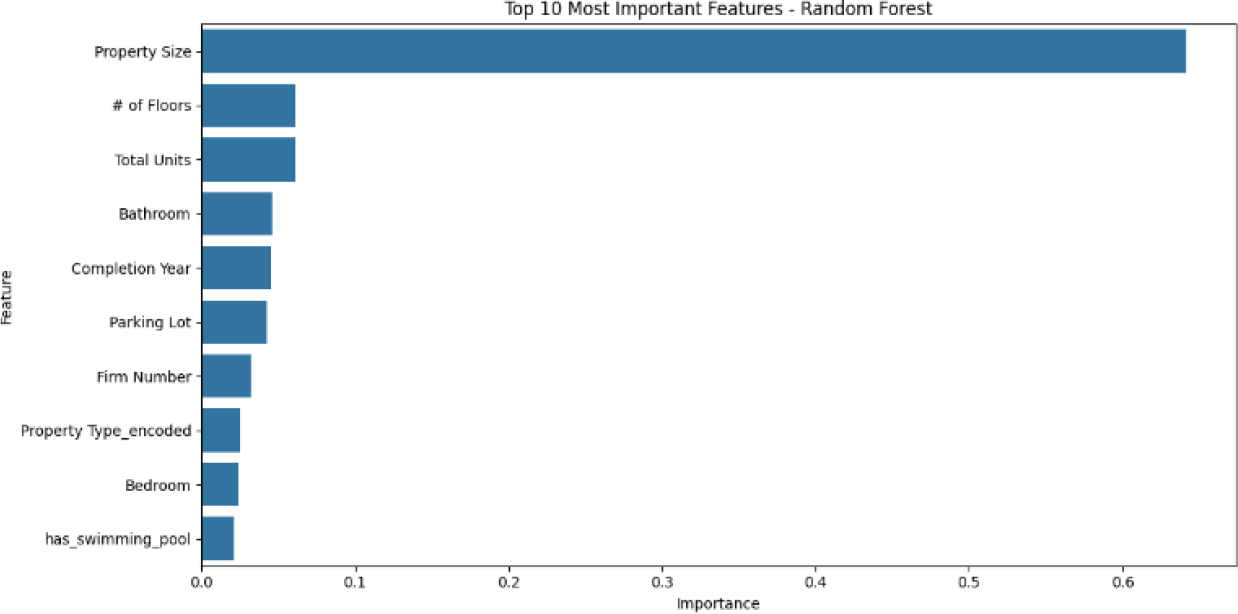
Figure 10:
Most important features for Random Forest.
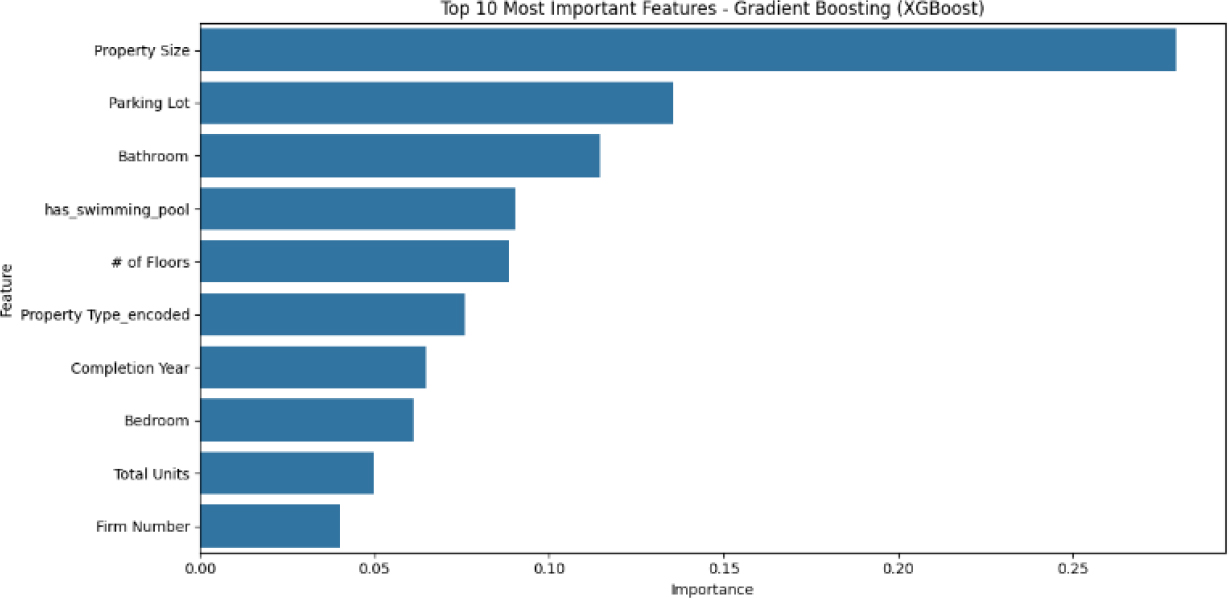
Figure 11:
Most important features for XGBoost.
As for underfitting, this happens possibly because the model isn’t complex enough to be able to capture the underlying patterns in the data. This can be seen from the Support Vector Regression (SVR) as it has the highest MAE and RMSE values which indicates a possibility that it could not capture the full complexity of the data.
Hyperparameter Analysis and Feature Importance
For this model Grid Search was applied to help improve the hyperparameters for each model. The best was selected based on the lowest cross-validation RMSE, and with that we got the results which can be seen based on the figures below.
Based on the figures above, XGBoost model exhibits the strongest feature importance. This can be seen by variables such as Property Size, Parking Lot, Bathroom and more. As for both Decision Tree and Random Forest it fails to capture the importance of certain features effectively.
Additional Visualizations
For this part, some extra figures will be shown such as the correlation matrix which represents a heat map to show how certain features can affect the target variable, which is the price. Not only that, but another visualization to be added in this section is the cross-validation result which will show a plot that compares cross-validation results for each of the models we used. This can help by providing an additional layer of validation for better model performance.
In conclusion, based on the results shown above and from what was discussed previously, XGBoost is the most effective model to predict the pricing of houses. The use of different feature selection models also assisted by picking what we think the most important features are which helped with the improvement of the model efficiency by removing less relevant features.
Research Direction and Future Work
The literature review revealed several gaps in current approaches to predicting condominium prices. Many studies focused on locational and structural features but often overlooked dynamic variables such as real-time market trends, environmental factors, and social influences. Additionally, popular machine learning models like Random Forest and XGBoost have demonstrated strong performance. There is limited exploration of how advanced techniques such as deep learning and hybrid models might further improve the accuracy of the model. Furthermore, many existing work are geographically restricted where insufficient representation of diverse regions in Malaysia. This study addresses some of these gaps by including a comprehensive dataset that includes a mix of various locational and structural attributes. This study also apply a multiple different algorithm to capture the complex relationships between each variable. However there remains significant room for improvement in this study. Below are several directions that future studies can take.
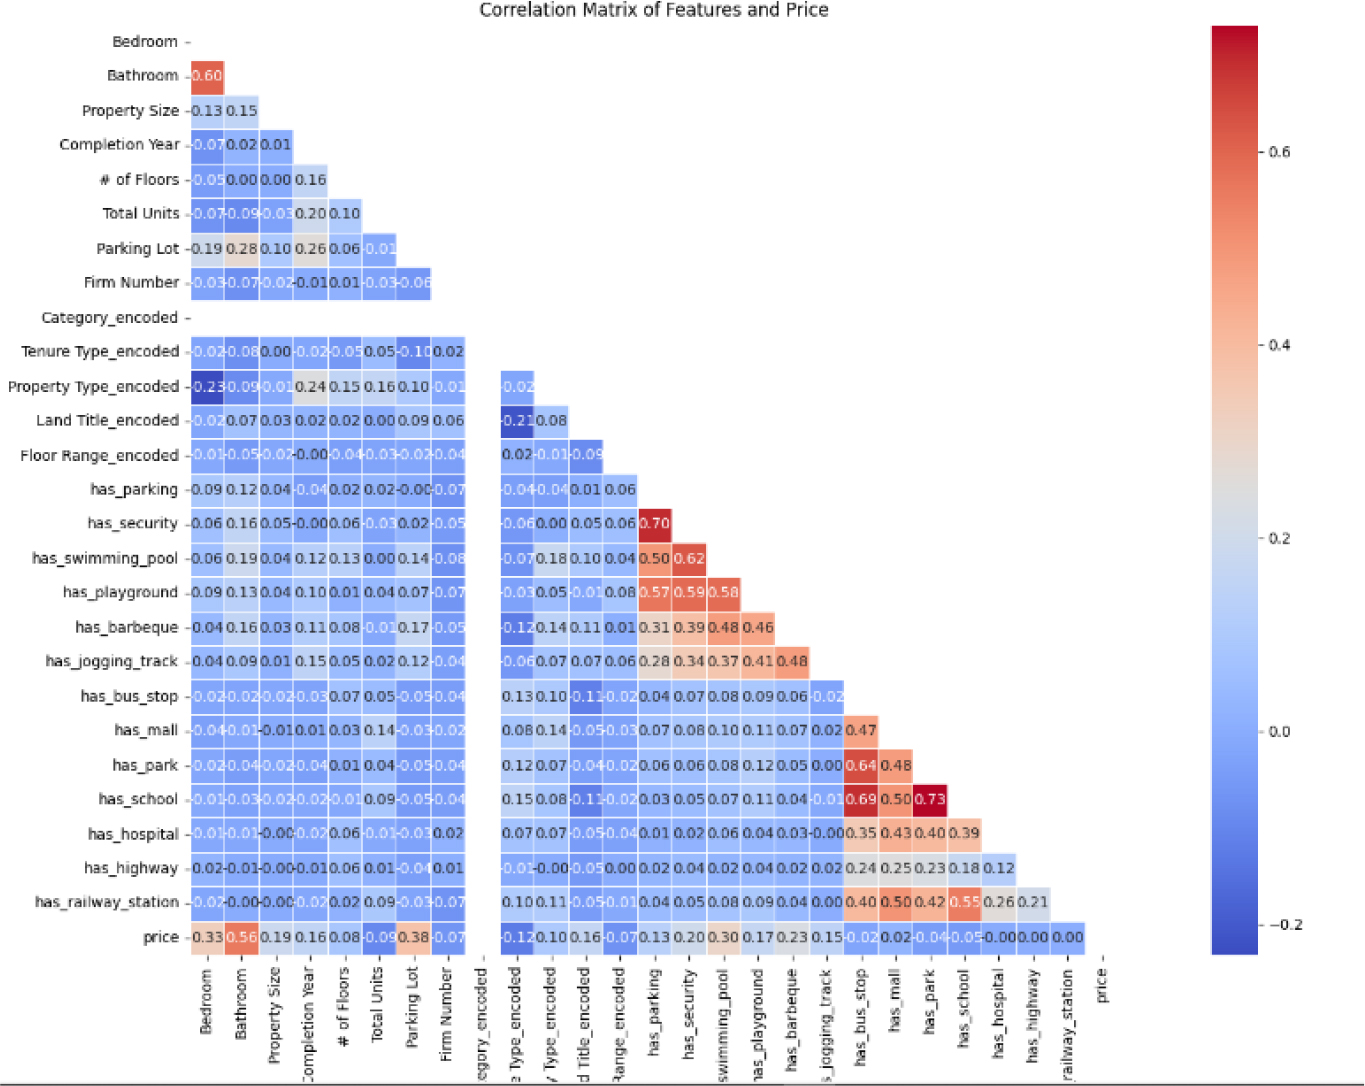
Figure 12:
Heat map used to show relationship between features and the price.
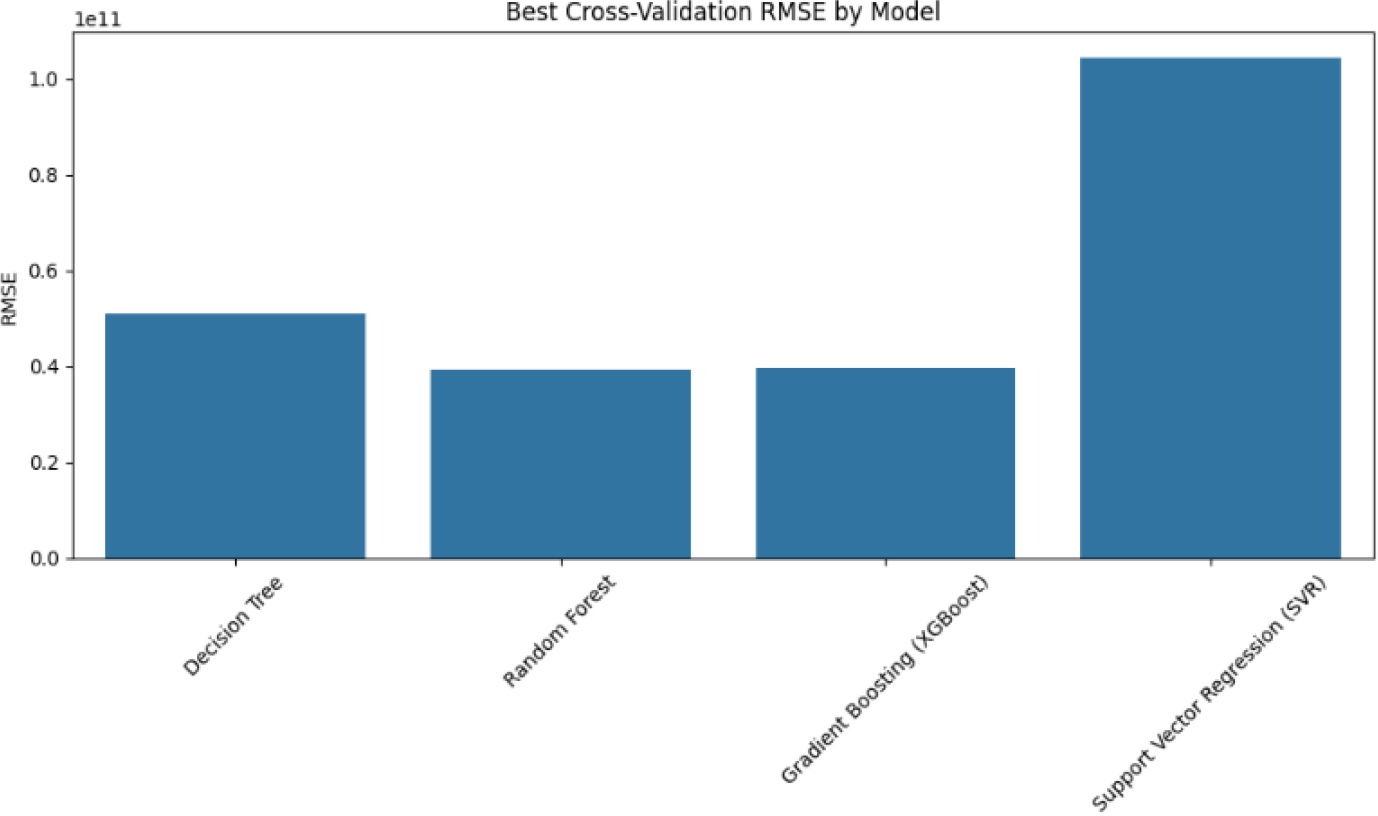
Figure 13:
Best cross-validation results.
FUTURE DIRECTIONS
Enhancing Data Diversity: Future research should aim to include data from underrepresented areas in Malaysia, such as smaller towns and rural regions. This would improve the model generalization and ensure it relevance across wider spectrum of real estate markets
Integration of Dynamic Feature: Including dynamic data like economic indicators such as inflation, interest rate etc., and real estate market trends, can offer more precise predictions by accounting changes over time
Implementation of Advanced Predictive Techniques: Exploring deep learning method like Recurrent Neural Networks (RNN) (Stryker, 2025) and Transformer model could capture sequential dependencies in pricing trends, while hybrid model that combine machine learning and statistical approaches may enhance performance.
Based on the results that we have obtained through the study we also would like to suggest some areas that need to be further investigate.
Real-Time Pricing Systems: Future studies could focus on building real-time pricing tools integrating with live market data. These tools could provide dynamic predictions for buyers, sellers and developers
Impact of Sustainability Features: Investing the influence of eco-friendly feature such as energy efficient design or green certifications on property pries in Malaysia could uncover valuable insights into sustainable real estate development.
Policy Impact on prices: Examining how government policies such as housing grants or tax incentives affect condominium prices would provide deeper understanding of the market
Regional Comparison: Conducting comparative studies across ASEAN countries could contextualize Malaysia’s real estate market within broader regional landscape.
In summary this study provides a solid foundation for predicting condominium prices while addressing some existing gaps. By expanding advanced techniques and exploring emerging trends. Future research can build on these findings to further enhance the accuracy and relevance of predictive models in real estate.
CONCLUSION
The study aimed to address the challenges of predicting condominium prices in Malaysia by using machine learning techniques on a comprehensive dataset. By using various features such as location, property size, amenities and proximity to essential services, the study provided a detailed analysis of factors influencing property prices. The methodology used are Linear Regression, Decision Trees, Random Forest, Gradient Boosting (XGBoost) and Support Vector Regression (SVR). Among these models, Gradient Boosting emerged as the most effective model, achieving the lowest MAE and RMSE while attaining the highest R-Squared value, thus demonstrating its capability to model complex relationship between variables.
This research contributes significantly to the field of property price prediction by:
Providing a comprehensive dataset and robust preprocessing techniques tailored to the Malaysian real estate context.
Evaluating multiple machine learning models to identify the most suitable approach for this problem.
Highlighting the importance of feature selection techniques, such as Recursive Feature Elimination (RFE), to enhance model performance.
The findings of this study have practical implications for all stakeholders in Malaysia’s real estate market. Accurate predictive models can assist buyer in making informed decision. Moreover, the research methodology serve as foundation for future studies, which can integrate real time data and advanced techniques to further improve prediction performance.
Cite this article:
Sathishkumar VE, Majid SB, Zhi CCC, Suhaimi PAIBF. Predicting Condominium Prices in Malaysia: A Comparative Analysis of Machine Learning Models. Info Res Com. 2025;2(1):135-51.
GeeksForGeek. (November 2, 2024) [Online]. Step-by-step guide to calculating RMSE
using Scikit-learn. Retrieved December 31, 2024, https://www.geeksforgeeks.org/
step-by-step-guide-to-calculating-rmse-using-scikit-learn/
GeeksForGeeks. (December 16, 2024a) [Online]. Linear Regression in machine learning.
Retrieved December 27, 2024, https://www.geeksforgeeks.org/ml-linear-r
egression/#what-is-linear-regression
GeeksForGeeks. (May 17, 2024b) [Online]. Decision tree. Retrieved December 27, 2024,
https://www.geeksforgeeks.org/decision-tree/
GeeksForGeeks. (December 11, 2024c) [Online]. Random forest algorithm in machine
learning. Retrieved December 27, 2024, https://www.geeksforgeeks.org/
random-forest-algorithm-in-machine-learning/
GeeksForGeeks. (March 31, 2024d) [Online]. Gradient boosting in ML. https://www.g
eeksforgeeks.org/ml-gradient-boosting/. [Accessed. 2024 December 2024].
J. M. Physiol..D. (20/1/2024) [Online]. What is feature engineering? Retrieved 2/1/2025,
https://www.ibm.com/think/topics/feature-engineering#:~:text=It%20o
ptimizes%20ML%20model%20performance,maximize%20model%20generalizabili
ty%20and%20optimization
MA, & Huda, S. A. N. (2019). A comparative study of machine learning algorithms for
property price prediction in Malaysia. Journal of Property Research, 36(4), 456–472.
T. Mohd. “Machine Learning Housing Price Prediction in Petaling Jaya, Selangor, Malaysia”
[Online]. Retrieved 10/12/2024, https://www.ijrte.org/wp-content/upload
s/papers/v8i2S11/B10840982S1119.pdf
Masrom, S., Mohd, T., & Abd Rahman, A. S. (2022). Green building factor in machine
learning based condominium price prediction. IAES International Journal of Artificial
Intelligence, 11(1), 291–299. https://doi.org/10.11591/ijai.v11.i1.pp291-299
MSN, & Fauzi, S. Z. O. A. (2020). Predicting housing prices using machine learning
techniques: A case study in Malaysia. Journal of Housing Research, 29(2), 145–158.
Onose, E. (August 8, 2023) [Online]. ‘R Squared: Understanding the Coefficient of
Determination,’ Arize. Retrieved December 31, 2024, https://arize.com/blog-course
/r-squared-understanding-the-coefficient-of-determination/#:~:text=R%2Dsquare
d%2C%20also%20known%20as,explained%20by%20the%20independent%20vari
ables
Ouko, A. (September 22, 2024) [Online]. ‘Adjusted R-Squared: A Clear Explanation with
Examples,’ datacamp. Retrieved December 31, 2024, https://www.datacamp.c
om/tutorial/adjusted-r-squared
Rahman, S. A. Advanced machine learning algorithms for house price prediction: Case
study in Kuala Lumpur [Online]. Retrieved 10/12/2024, https://www.researchg
ate.net/publication/357455077_Advanced_Machine_Learning_Algorithms_for_Ho
use_Price_Prediction_Case_Study_in_Kuala_Lumpur#:~:text=House%20price%20is
%20affected%20significantly,model%20is%20reliable%20and%20acceptable
Rahman, S. A., Zulkiefly, N. H., Mutalib, S., & Ibrahim, I. (2021). Advanced machine learning
algorithms for house price prediction: Cases study in Kuala Lumpur. International
Journal of Advanced Computer Science and Applications, 12(12), 736–745.
Scikit. Recursive feature elimination [Online]. Retrieved 2/1/2025, https://www.
scikit-yb.org/en/latest/api/model_selection/rfecv.html#:~:text=Recursive%20feat
ure%20elimination%20(RFE)%20is,the%20selected%20number%20of%20features
Sethi, A. (November 20, 2024) [Online]. Support vector regression tutorial for machine
learning. Analytics Vidhya. https://www.analyticsvidhya.com/blog/2020/
03/support-vector-regression-tutorial-for-machine-learning/#h-the-idea-behindsupport-
vector-regression. [Accessed. 2024 December 2024].
Siang, A. C. C. (October 26, 2023) [Online]. A comprehensive analysis and predictive
modeling of condominium prices in Malaysia. Rpubs by Rstudio. https://rpubs.com/a
lvinchua95/abc12345?. [Accessed 2024 November 26].
Stryker, C. (October 4, 2024) [Online]. What is a recurrent neural network? IBM. Retrieved
January 5, 2025, https://www.ibm.com/think/topics/recurrent-neural-net
works
T. (2019). Mohd, S. Masrom and N. Johari, “Machine learning housing price prediction in
Petaling Jaya, Selangor, Malaysia,” International Journal of Recent Technology and
Engineering, 8(11), 542–546.
TWM, & Jie, W. W. H. L. W. (2021). Machine learning approaches for real estate price
prediction in Malaysia. International Journal of Housing Markets and Analysis, 14(2),
245–258.
Yah, F. Machine learning: Prediction of house prices in Malaysia [Online]. Retrieved
10/12/2024, https://medium.com/@faizyah/machine-learning-prediction-ofhouse-
prices-in-malaysia-a9140c327c8c
Yee, L. W. Using machine learning to forecast residential property prices in overcoming
the property overhang issue [Online]. Retrieved 10/12/2024, http://epri
nts.utm.my/96032/1/LimWanYee2021_UsingMachineLearningtoForecast.pdf
Yee, L. W. Using machine learning to forecast residential property prices in overcoming the
property overhang issue [Online].
Yee, L. W., Bakar, N. A. A., Hassan, N. H., Zainuddin, N. M. M., Yusoff, R. C. M., & Rahim,
N. Z. A. (2021). Using machine learning to forecast residential property prices in
overcoming the property overhang issue IEEE International Conference on Artificial
Intelligence in Engineering and Technology (IICAIET), 8(2022) (pp. 1–6). https://doi.o
rg/10.1109/IICAIET51634.2021.9573830
Zulkifley, H. N., Rahman, S. A., Ubaidullah, N. H., & Ibrahim, I. (2020). House price prediction
using a machine learning model: A survey of literature. I.J. Modern Education and
Computer Science, (6), 46–54.

