ABSTRACT
This paper aims to find the research performance of different inventory models on inventory management. Inventory management employs the Economic order quantity (EOQ) model and the Economic production quantity (EPQ) model to determine the optimal order quantities for purchasing and manufacturing. The developed EOQ model was predicated on the constants of demand rate, holding cost, purchasing cost, and ordering cost. The EPQ model is predicated on the same assumptions as the EOQ model, namely constant holding costs and constant demand. This study aims to identify the citation impact of the most productive countries and journals based on the number of publications on inventory models in a fuzzy environment. About 3510 publications were obtained from the Web of Science between 2004 and 2023. In addition, this study uses “co-word cluster network analysis” to determine how this topic has evolved thematically over time. Additionally, this study used a thematic evolution map, a keywords overlapping map, and strategic maps to quantify and visualise the distribution and impact of this topic’s research fronts at successive periods. The findings of this study will help establish future research guidelines that tackle the advancement of different inventory models on inventory management.
INTRODUCTION
Controlling the materials used in services and manufacturing is a major goal of inventory management. Maintaining the proper amount of each material to meet demand while averting shortages and excess inventory is the main objective of this function (Alfares and Ghaithan, 2019). An efficient organization must have a solid inventory management system.
According to Kotler (2000), the term “inventory management” is the collective term for all activities involved in setting and monitoring the amounts of finished goods, semi-finished materials (also known as “working progress”), and raw materials in stock to guarantee adequate supply and low costs related to excess stock (Agarwal, 2014).
Effective inventory management requires the use of sophisticated inventory models to determine the optimal order quantities, reorder points, and associated costs of keeping inventory (Mittal et al., 2023). Two most often used models are the Economic Production Quantity (EPQ) model and the Economic Order Quantity (EOQ) model.
Economic Order Quantity (EOQ), an inventory management system, displays the quantity of an item in an effort to reduce the overall cost of handling inventory (handling cost) and order processing (ordering cost) (Senthilnathan, 2019). Originally proposed in 1913 by Ford W. Harris, the EOQ model and Hax and Candea (1984) credit R. H. Wilson and K. Andler with providing the model’s detailed analysis and implementation. The developed EOQ model was predicated on the constants of demand rate, holding cost, purchasing cost, and ordering cost (Alfares and Ghaithan, 2019).
The three primary focuses of inventory planning and control are system design, operation, and control. While inventory planning entails the specification of inventory system procedures, inventory control is a two-dimensional problem primarily centered around two fundamental questions. These inquiries are:(1) How much should one order or make? –dimension of the amount, (2) when should I place my order or start producing? -dimension of the time (Cheng, 1989).
The process of figuring out the most cost-effective production quantity under generally stable conditions is known as the classical Economic Production Quantity (EPQ) inventory model.These prerequisites are:(1) There is instantaneous production. (2) Backorders are not permitted (Cheng, 1989).
Classification of inventory model under fuzzy environment
Classification of the inventory models under fuzzy environment represented in below tree.
Cloudy EOQ model under fuzzy environment
The cloudy fuzzy EOQ model is an extension of the traditional EOQ model that considers lack of precision and uncertainty in demand as well as other parameters. Rather than taking a single, deterministic demand value, this model takes into account a range of potential values (Mittal et al., 2023).
There are two types of cloudy fuzzy EOQ model on the basis of quantity. These types are:
(1)Without Backorder In the cloudy fuzzy EOQ model, it is defined that customers will not wait for products without backorders and that demand cannot exceed available inventory.For the traditional EOQ model inventory management problem, Karmakar introduced a new fuzzy number,namely the cloudy fuzzy and its advance de-fuzzification technique. Karmakar introduced a new fuzzy number called the cloudy fuzzy and its new de-fuzzification technique (Mittal et al., 2023).
(2)With Backorder Under the cloudy fuzzy environment, De and Mahata (2016) address the traditional economic order quantity model with backorder (De and Mahata, 2017). After a crisp model is taken, it is fuzzified to obtain a decision under the cloudy fuzzy demand rate (Bj¨ork, 2009).
There are two types of cloudy fuzzy EOQ model on the basis of quality. These types are:
(1) Deteriorating items Things lose their usefulness with time and deteriorate. With deteriorating items, Shah and Patel created a EOQ model under the cloudy fuzzy (De and Mahata, 2017). It has been noted that the solutions under crisp environment, fuzzy environment, and cloudy fuzzy environment differ significantly from one another (Shah and Patel, 2022). (2) Imperfect quality items De and Mahata developed a cloudy EOQ model under fuzzy environment that allows for proportionate discounts within allowable limits on low-quality items (De and Mahata, 2019; Khan et al., 2011).
Cloudy EPQ model under fuzzy environment
Ajoy Kumar Maiti’s research focused on an imperfect production process with a fuzzy demand rate is considered in the economic production lot-size model under fuzzy environment (Maiti, 2021). The traditional economic production lot-size model holds that the process of producing a single product or several is inflexible and predetermined (Jaber et al., 2008). It is observed that output is influenced by demand. When demand increases, consumers buy more, and producers have to increase output to meet the growing market demands. The goal of the research is to create a mathematical model that maximizes EPQ in various contexts, such as clear, general fuzzy, and cloudy fuzzy items.
Dense inventory model under fuzzy environment
Triangular dense fuzzy set and a advance de-fuzzification method that goes along with them were introduced by De and Beg in 2016 (De and Beg, 2016). An expansion of conventional inventory models, fuzzy logic is used by the dense fuzzy inventory model to handle uncertainties and inaccurate data in inventory management (Mittal et al., 2023).
Green inventory model was unveiled in 2023 by Maity, Chakraborty,De,Kumar and Pal (Maity et al., 2023). This model incorporates a number of variables, including stock, price, demand, and environmental concerns. In order to represent holding costs and maintenance technology for control the carbon emission, it also includes a quadratic function of time. A dense fuzzy number with pentagonal intuitionistic is used to represent the demand rate.
Using non-linear equations to solve a parabolic triangular membership function, Maity, De, Pal, and Mondal examined a growing items EOQ model with a parabolic dense fuzzy lock demand rate (Maity et al., 2021).
The concepts of symmetric linear and non-linear heptagonal dense fuzzy numbers and non-linear heptagonal dense fuzzy numbers were introduced by Maity, De, and Mondal (Maity et al., 2020).

Intuitionistic fuzzy optimization technique
In 2013, an intuitionistic optimization method under fuzzy environment was introduced for Pareto’s optimal solution of manufacturing inventory models with shortages by Chakrabortty, Pal, and Nayak (Chakrabortty et al., 2013). De, Goswami, and Sana created a fuzzy inventory model with backorder solution procedure that treated all the fuzzy numbers in 2014 (De et al., 2014). Bhaya, Pal, and Nayak employed the intuitionistic optimization method under fuzzy environment to analyze the EOQ model containing two types of imperfect quality items: throw away and reworkable items in 2014 (Bhaya et al., 2014). In 2018, Mondal, Garai, and Roy introduced single-objective Economic Order Quantity (EOQ) model with restricted space and deterministic in an intuitionistic fuzzy environment (Mondal et al., 2018). Sahoo, Acharya, and Patnaik focused on minimizing the overall costs by characterizing a fuzzy model in 2022 using a “generalized pentagonal intuitionistic fuzzy number” for holding cost per unit and a “ranking generalized pentagonal intuitionistic fuzzy number” for de-fuzzification (Sahoo et al., 2022).
Type 2 inventory models under fuzzy environment
The two steps of the entire de-fuzzification process for a type 2 fuzzy set are “type reduction” and “de-fuzzification”. The process of converting a type 2 fuzzy set into a corresponding type 1 fuzzy set, is called “type reduction”. After that, it is simple to de-fuzzify the type 1 fuzzy set to a crisp value. Ravi Shankar Kumar presented an inventory model in 2018, titled “Modelling a Type-2 fuzzy inventory system considering items with imperfect quality and shortage backlogging” (Kumar, 2018).
Yanan Li developed a type 2 fuzzy optimization method that he applied to a multi-item inventory problem (Li, 2019). He began by discussing mean reduction strategies and the type 2 fuzzy variables expected value under standard possibility distributions (Li, 2019).
This study pinpoints the highly developed motor themes in inventory models over the past 20 years. This paper also addresses the themes for this research area’s future advancement.
METHODOLOGY
Data collection for publications
The publication data were collected from the WoS (Web of Science) Core Collection, which is currently owned by Clarivate Analytics but was formerly owned by Thomson Reuters, using a particular search string. These databases are the most widely used data sources for studies pertaining to bibliometrics and cover a broad spectrum of research fields. Using the database’s “Advance Search” feature, publication data was retrieved using the search string (TS=(Inventory AND (EOQ OR EPQ OR Intuitionistic OR Fuzzy)). In the last 20 years, there have been about 3510 publications reported (2004-2023). These publications were used to analyze a variety of parameters.
Growth of bibliometric parameters over time
For a comparative study, publication information for top most 10 countries was taken from the database. Using the WoS’s “Analyze Results” feature, all bibliographic records were downloaded for additional analysis. In order to verify the identity of the collected data, publication data, country’s names and journals were examined independently. Additional data analysis was done using R and Microsoft Excel. To illustrate how research in this field has evolved over the course of 20 years, the research was further split into four five-year periods.
Analysis of citation and h-index
By choosing the “Create Citation Report” key, citation information for all publications was obtained (Ghosh et al., 2020). For additional examination, citation reports for specific countries and journals were generated and downloaded. Plots of graphs were created to display the trends in citations, h-indices, and the quantity of publications for quality analysis over different time periods. The WoS was also used to analyse h-index data for countries and journals. In order to normalize the citation data of all publications, the mean total citation per period was computed and graphically displayed.
Analysis of thematic evolution
“Science Mapping Analysis Software Tool (SciMAT)”, which offers a long-term evaluation, was used to examine the thematic evolution of all publications (Cobo et al., 2012). As previously indicated, the entire 20-year period was further split into four five-year intervals in order to comprehend the thematic development of all publications at different points in time. The operational definition and labeling of themes was carried out using keyword clusters obtained from co-word analysis (Ghosh et al., 2020). To comprehend the thematic evolution, information about the strategic map clusters was tabulated and included document frequency, document h-index, document citations, centrality, and density for various time periods. The following cluster network processing parameters were used: 1) For all publications, the minimum document frequencies were set at 1,2,3,4 over successive periods. 2) The matrix preference chosen was co-occurrence; 3) The minimum co-occurrence frequencies were 1, 2, 3, and 4 for all publications over the course of successive periods; 4) The normalization measure selected was the equivalency index; 5) The basic centers clustering algorithm was applied, with a minimum size of network is 4 and a maximum size of network is 8 for all publications; 6) The secondary mappers and the core mappers were both chosen; 7) For node display, the h-index and total citation evaluation metrics were chosen; 8) For longitudinal and overlap mapping, the inclusion index and Jaccard’s index were selected as metrics (Hamers et al., 1989; Tijssen and Van Raan, 1989). An overlapping map and a thematic evolution map are used to illustrate the thematic evolutions.
RESULTS
Contribution by top 10 countries
From 2004 to 2023, a total 3510 publication were found in the WoS Core Collection database. It was found that 78 countries had contributed to these publications. It was discovered that the top 10 and the top 20 countries contributed 77.38% and 89.29%, respectively, of all publications. Based on the publication information presented in Figure 1, China has contributed the highest percentage of publications (29.80%), followed by the India (17.52%). This figure reflects the productivity of the top most 10 countries.
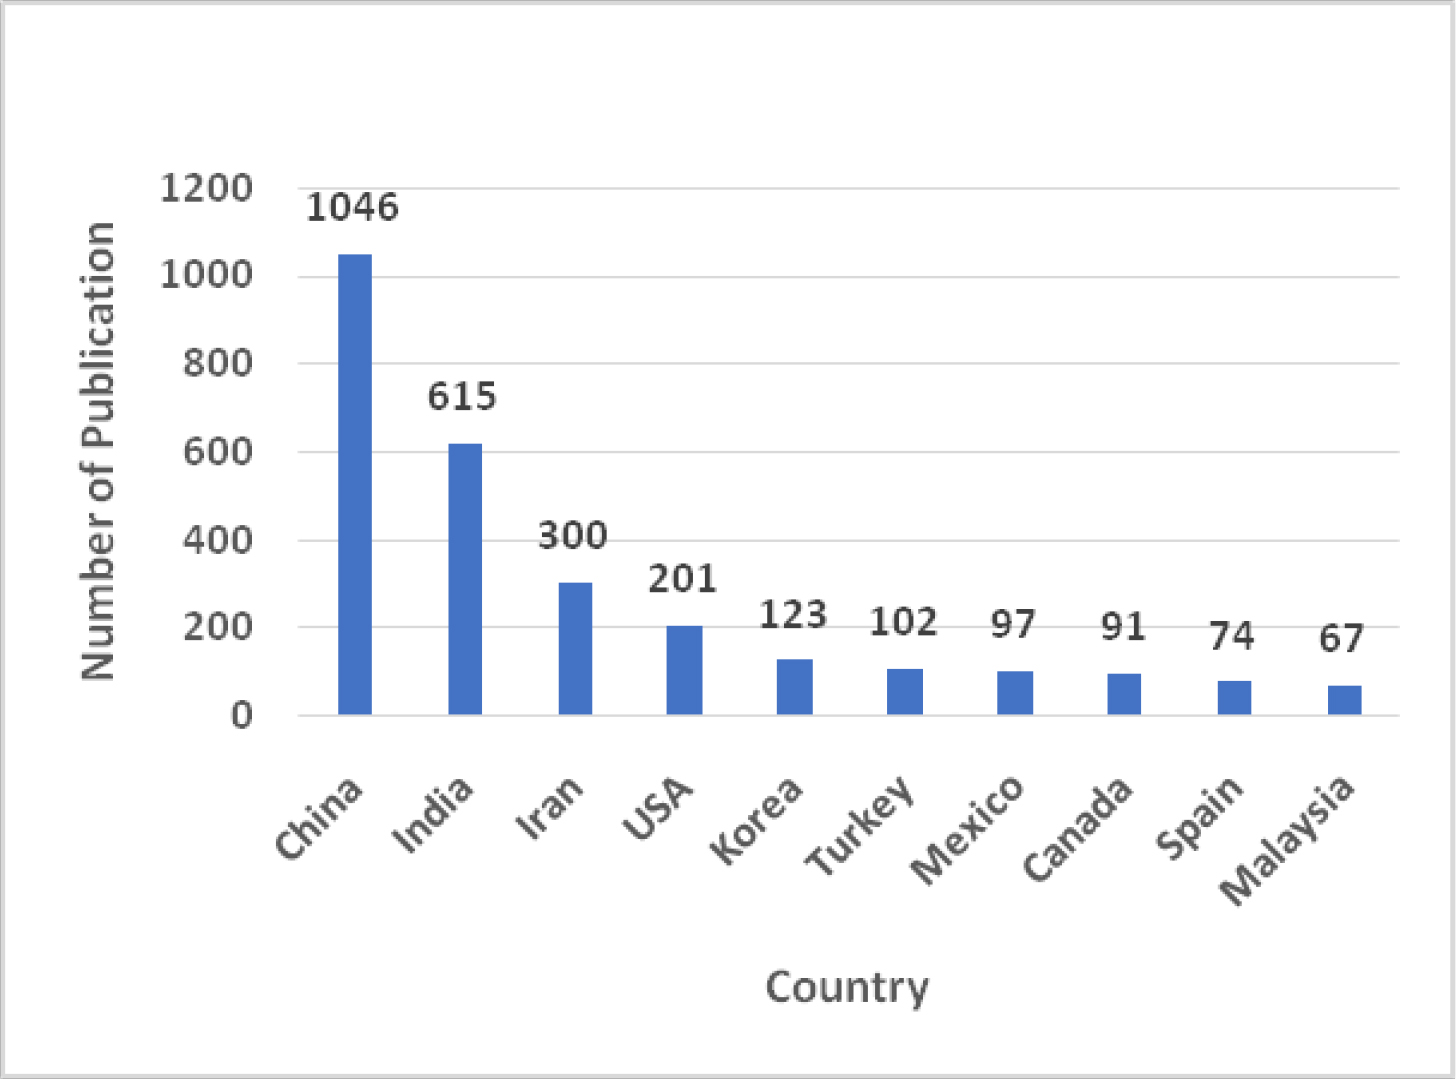
Figure 1:
Considering number of publications top 10 countries.
Figure 2 represents the total citation of the top 10 countries, considering the quantity of publications. Based on the data presented in Figure 2, China has contributed the highest percentage of citations (24.28%), followed by the India (12.77%). This figure reflects the quality of publications of the top 10 countries.
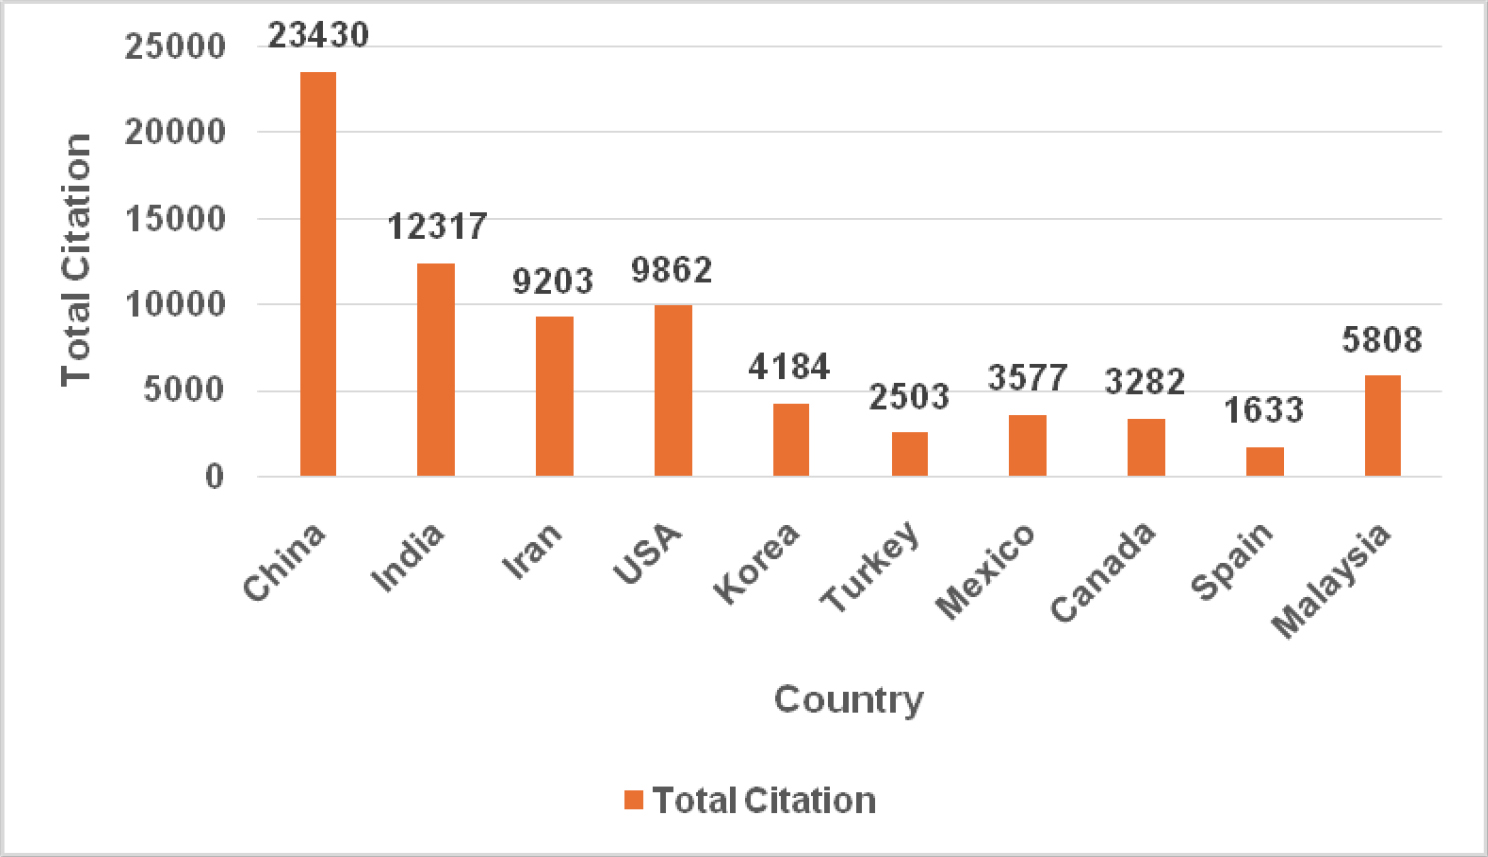
Figure 2:
Top 10 country’s Total Citation.
Figure 3 represents the ACPP of the top 10 countries, considering the number of publications. This figure reflects the citation impact of the top 10 countries. From the top 10 countries, Malaysia has contributed the highest ACPP with an ACPP of 86.70, followed by USA with an ACPP of 49.10.
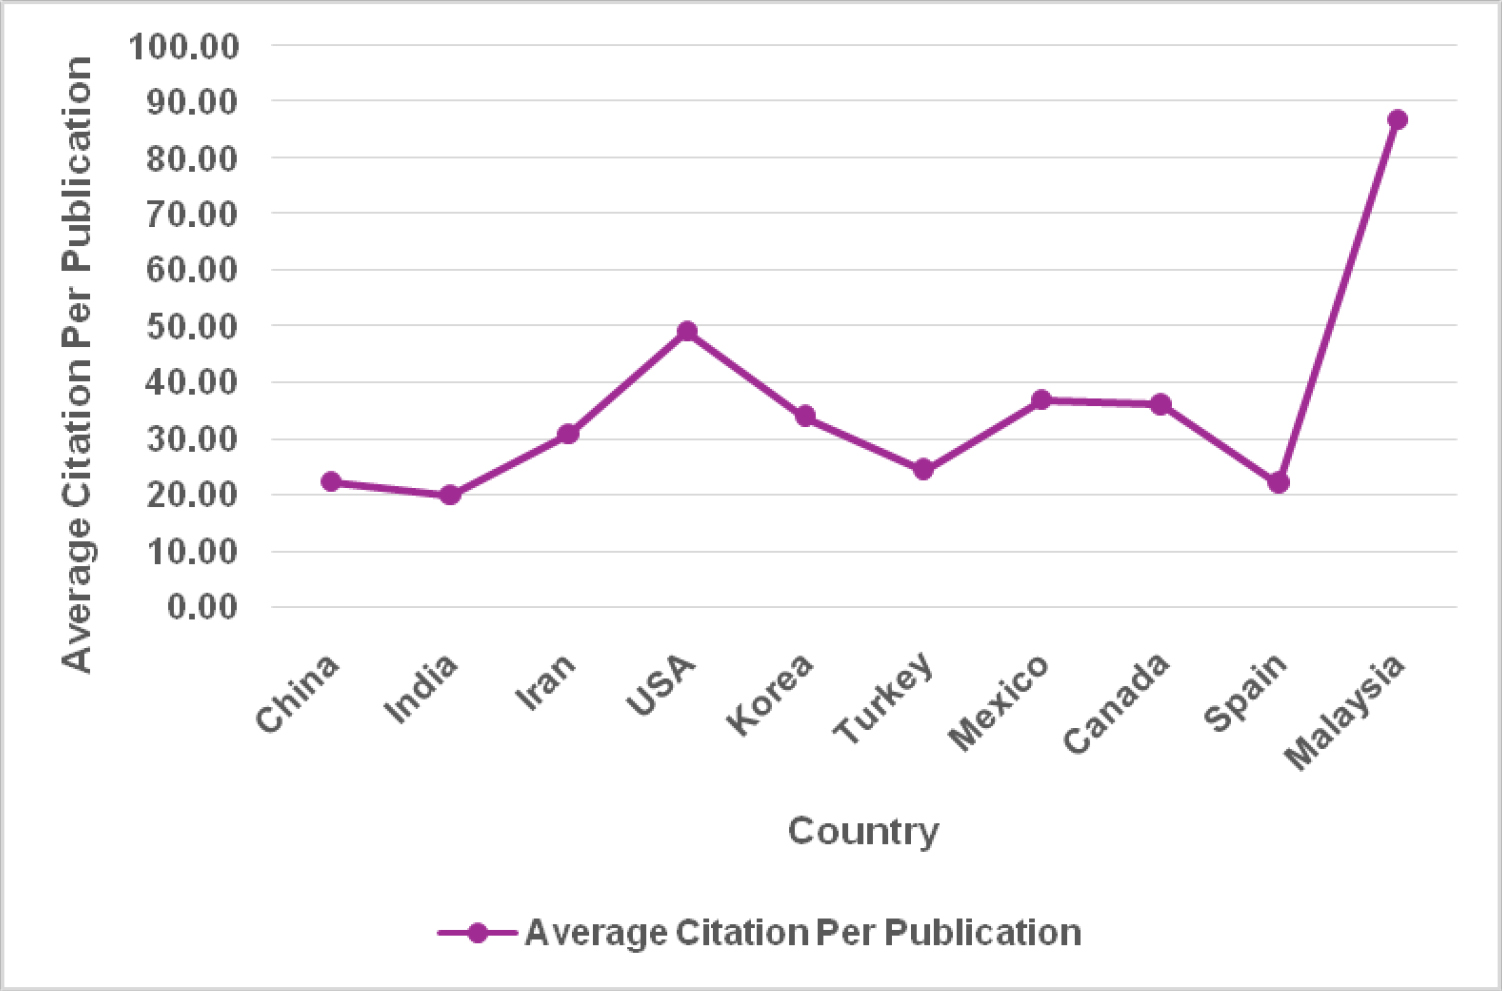
Figure 3:
Top 10 country’s Average Citation Per Publications.
Growth of publications across periods
The period-wise growth of quantity of publications is shown in Figure 4. It was discovered that between the first period (2004-2008) and the last period (2019-2023), number of publications had increased. It demonstrated how Publications increased from 509 to 1122 with a CPGR of 30.14%.
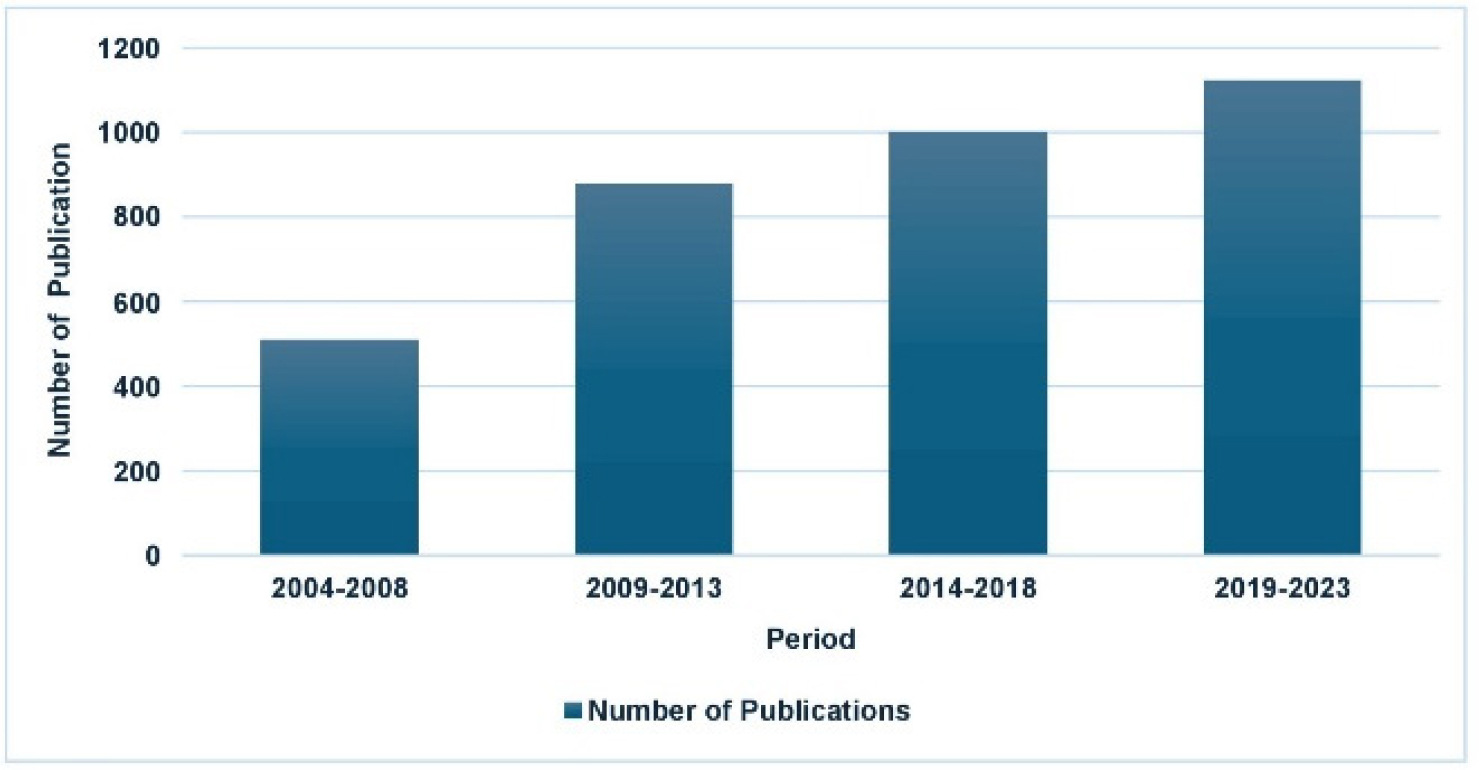
Figure 4:
Period-wise Number of Publications.
Impact of period-wise citations
Figure 5 represents the h-index at successive periods. The citations of the papers, which indicate the publication’s productivity and quality, determine the h-index. Figure 6 represents the mean total citation per period. It was discovered that between the first period (2004-2008) and the third period (2014-2018), mean total citation per period had increased. The mean total citation per period increased from 1.96 during the first period (2004-2008) to 3.62 during the third period (2014-2018) then had decreased to 3.08 during the last period (2019-2023).
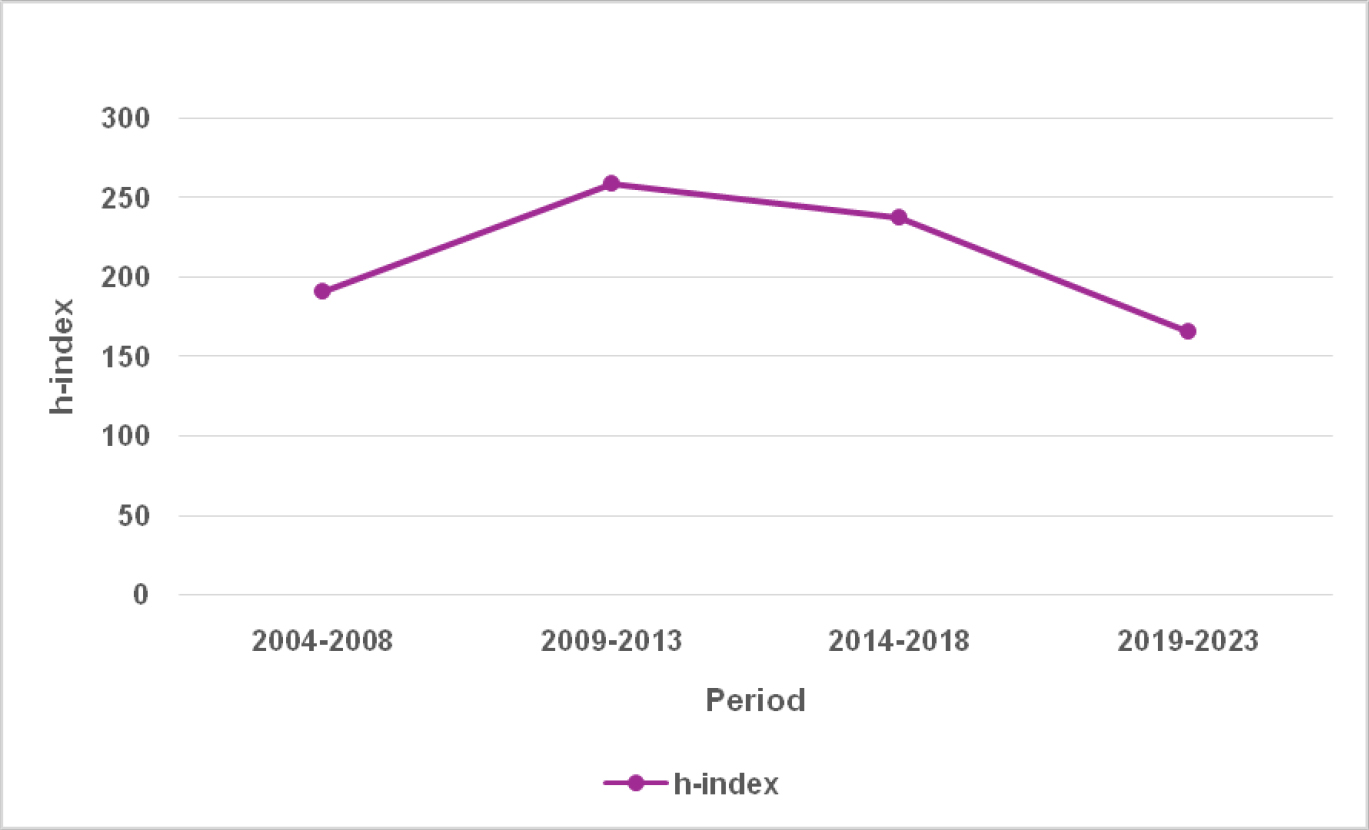
Figure 5:
Period-wise h-index.
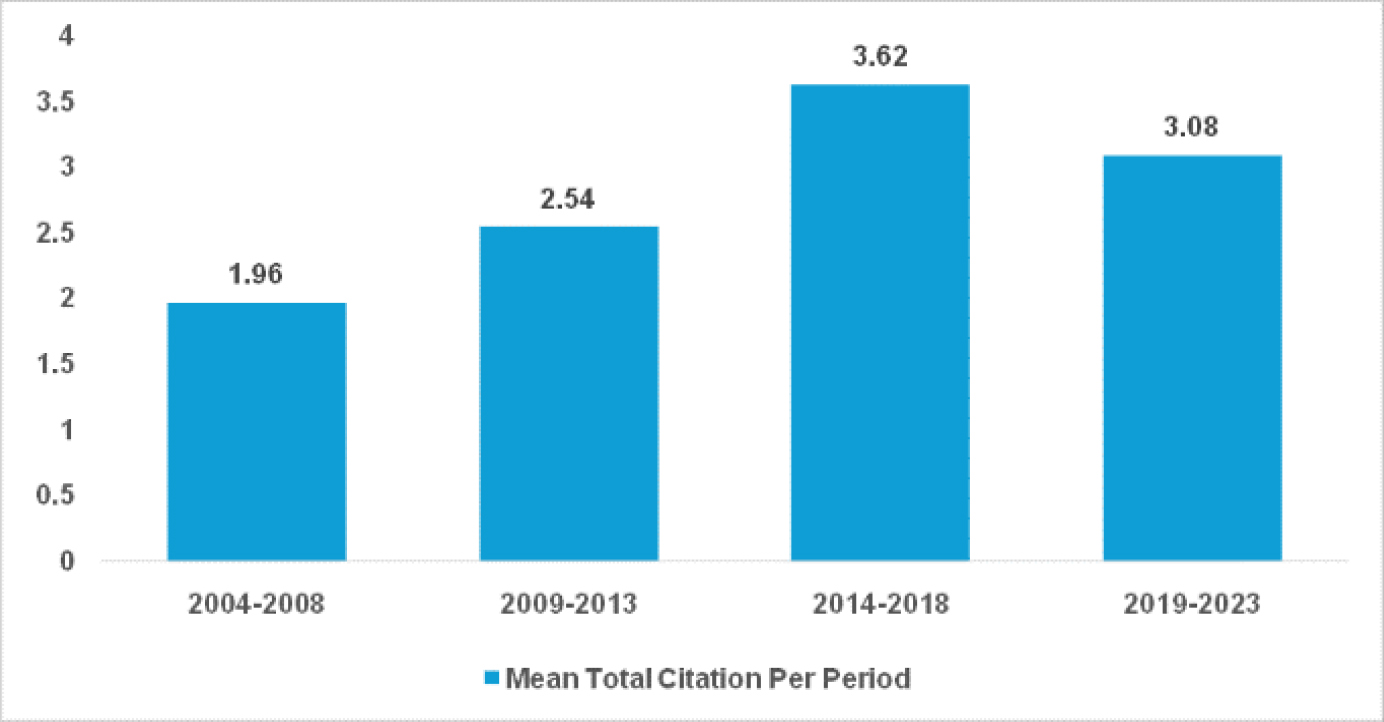
Figure 6:
Period-wise mean total citation.
Contribution of top 20 journal
There have been 672 journals under which all publications have been published; the top most 20 journals have been published in 44.52% of all publications.
Figure 7 represents the number of publications and the total citations of the top 20 journals, considering the number of publications on all publications. The International Journal of Production Economics has published the highest number of publications. The International Journal of Production Economics has published 191 number of publications with 5.98% distribute, followed by Computers and Industrial Engineering has published 162 number of publications with 5.08% distribute, European Journal of Operation Research has 148 number of publications with 4.64% distribute, Applied Mathematical Modeling has 116 number of publications with 3.63% distribute, International Journal of Production Research has published 98 number of publications with 3.07% distribute and other journals with less than 3% publication distribute. The top 20 journals, considering the quantity of publications had contributed in total citation 50.27% with respect to all journals total citation. International Journal of Production Economics has the highest total citation count of 9717, with 10.03%. Followed by the European Journal of Operation Research, which has a total citation of 8024, with an 8.28% distribution and other journals with less than an 8% citation distribution.
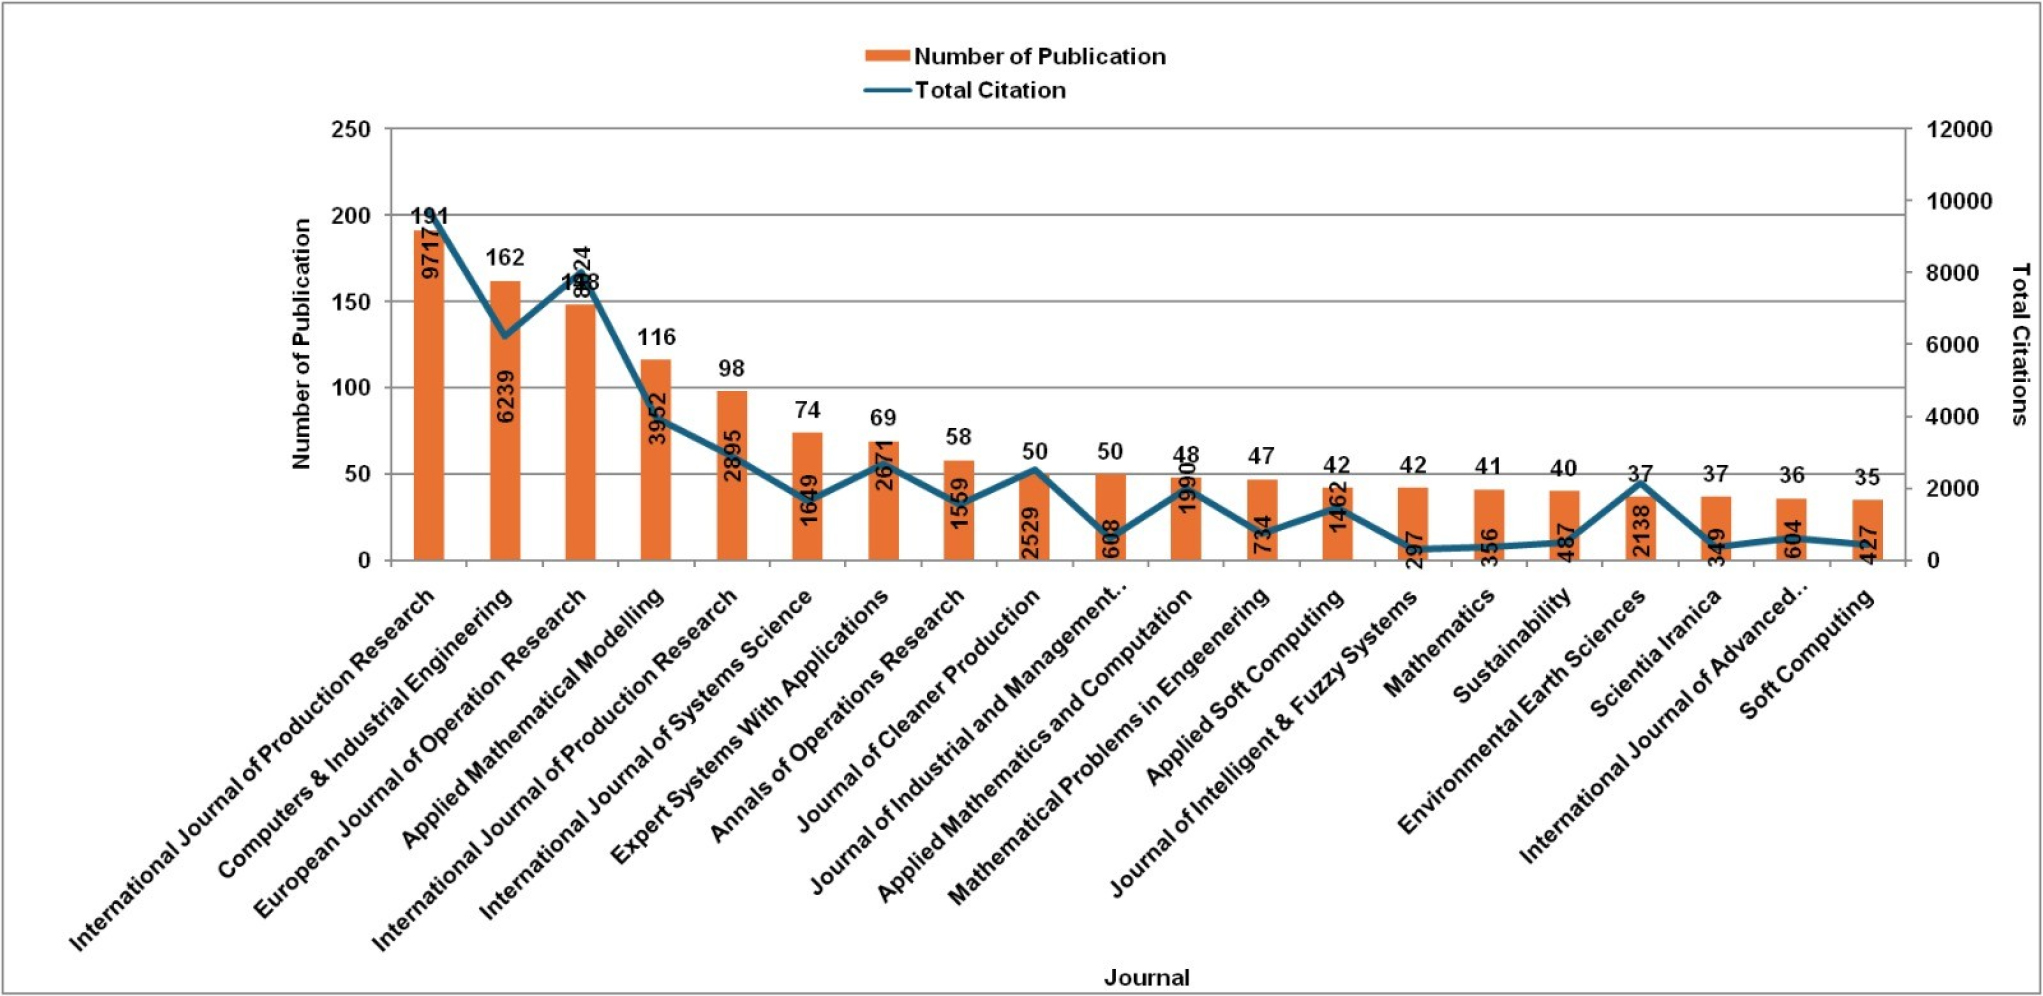
Figure 7:
Number of publications and Total Citation by 20 journals.
Figure 8 represents ACPP and h-indices of the top 20 journals, considering the quantity of publications. The average of ACPP of the top 20 productive journals is 28.69, which is a little bit higher than the ACPP (21.1) of total journals. The Environmental Earth Sciences has the highest ACPP of 57.78 followed by European Journal of Operation Research with an ACPP of 54.22, International Journal of Production Economics with an ACPP of 50.87, Journal of Cleaner of Production with an ACPP of 50.58. It has been discovered that another sixteen journals scored an ACPP of less than 50. The average of h-index of the top 20 journals is 25.95. The International Journal of Production Economics has the highest h-index of 60, followed by European Journal of Operation Research with an h-index of 53, and Computers and Industrial Engineering has an h-index of 48. It has also been discovered that another seventeen journals scored an h-index of less than 40.

Figure 8:
Average citation per period and h-index by top 20 journals.
Analysis of clusters of keywords
To ascertain the conceptual structure of the documents that address a similar topic, keywords were used to conduct co-word analysis using Multiple Correspondence Analysis and cluster analysis. Figure 9 displays the conceptual structure map. On the map, keywords are represented as points and the relative positions of the points determine the results that are displayed. Three clusters were formed by the co-word analysis: points that are closer together indicate that the article discussed them together more thoroughly, while points that are farther apart indicate that the article only briefly discusses them together.
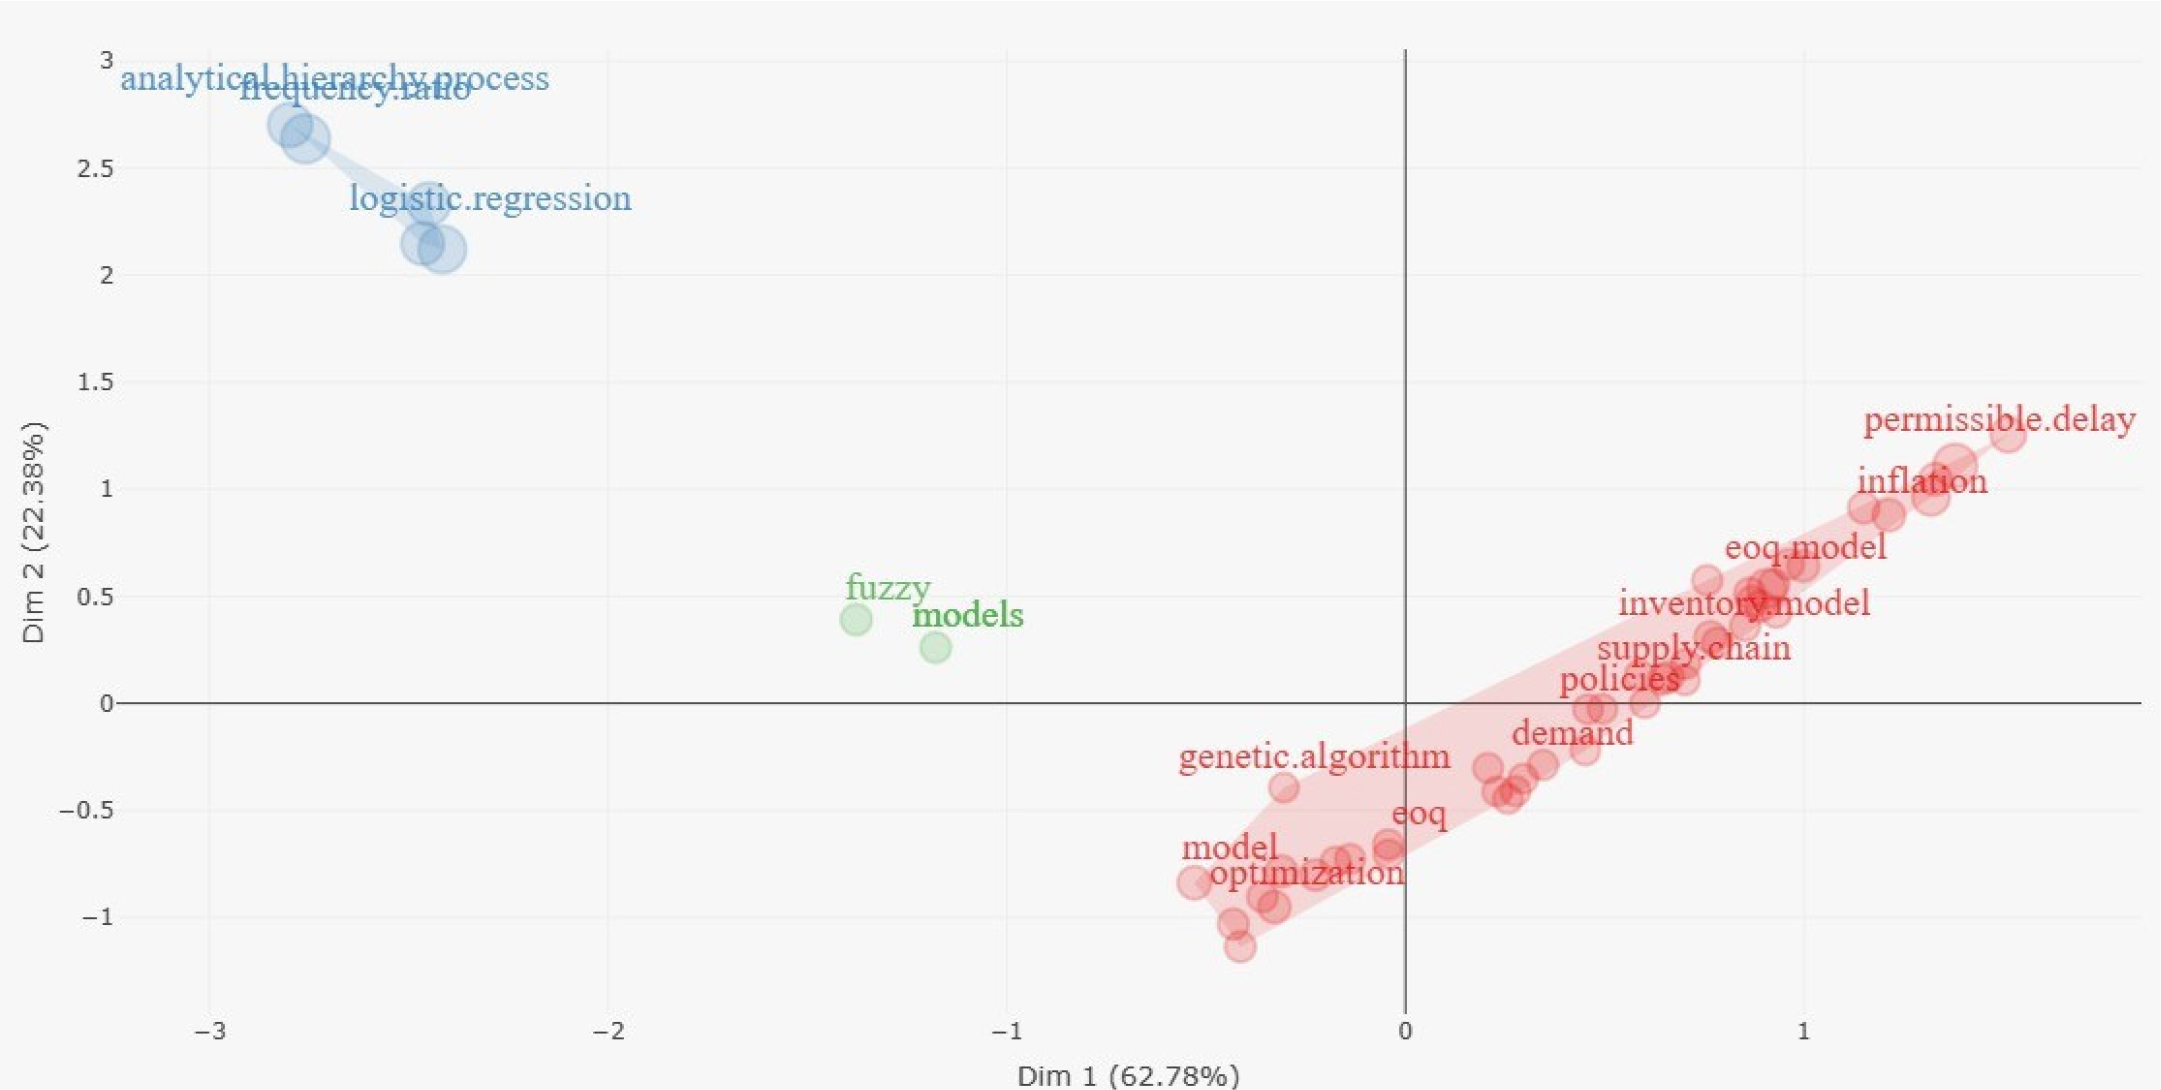
Figure 9:
Conceptual structure.
Cluster 1 this cluster is the biggest cluster with 44 keywords including the most frequently occurring terms like EOQ Model, Inventory model, Supply chain, Lot-Size, Shortages, Landslide, Demand, Permissible Delay and Deteriorating items. The most significant cluster is represented by this cluster. Cluster 2 this cluster is the small cluster with 5 keywords including the occurring terms like Logistics regression, Frequency ratio and Analytical hierarchy process.
Cluster 3 this cluster is the smallest cluster with 2 keywords like Fuzzy and Models.
Measurement of quantitative and qualitative development
Over time, strategic diagrams were used to illustrate thematic evolution. In strategic diagrams, themes were plotted as circles that represented various theme clusters based on centrality and density. The circle’s size corresponds to the quantity of documents that contain its linked or related keywords; this is known as document frequency. According to Cobo et al., the strategic diagrams can be interpreted in the following ways: “motor themes” are represented by the top-right quadrant; “highly developed and isolated themes” are represented by the top-left quadrant; “emerging or declining themes” are represented by the bottom-left quadrant; and “basic and transversal themes” are represented by the bottom-right quadrant (??).
During the first period (2004-2008), only 241 keywords were found from the total 509 publications. Twenty three themes with relatively low document frequencies were recorded during the first period. Table 1, Figure 10 shows that the theme “TIME-VARYING-DEMAND” has the highest document frequency of 61 followed by “PERMISSIBLE-DELAY” with document frequency of 60.The theme “PERMISSIBLE-DELAY” is the most significant and pertinent theme, with a higher citation score of 3017 according to document citation.
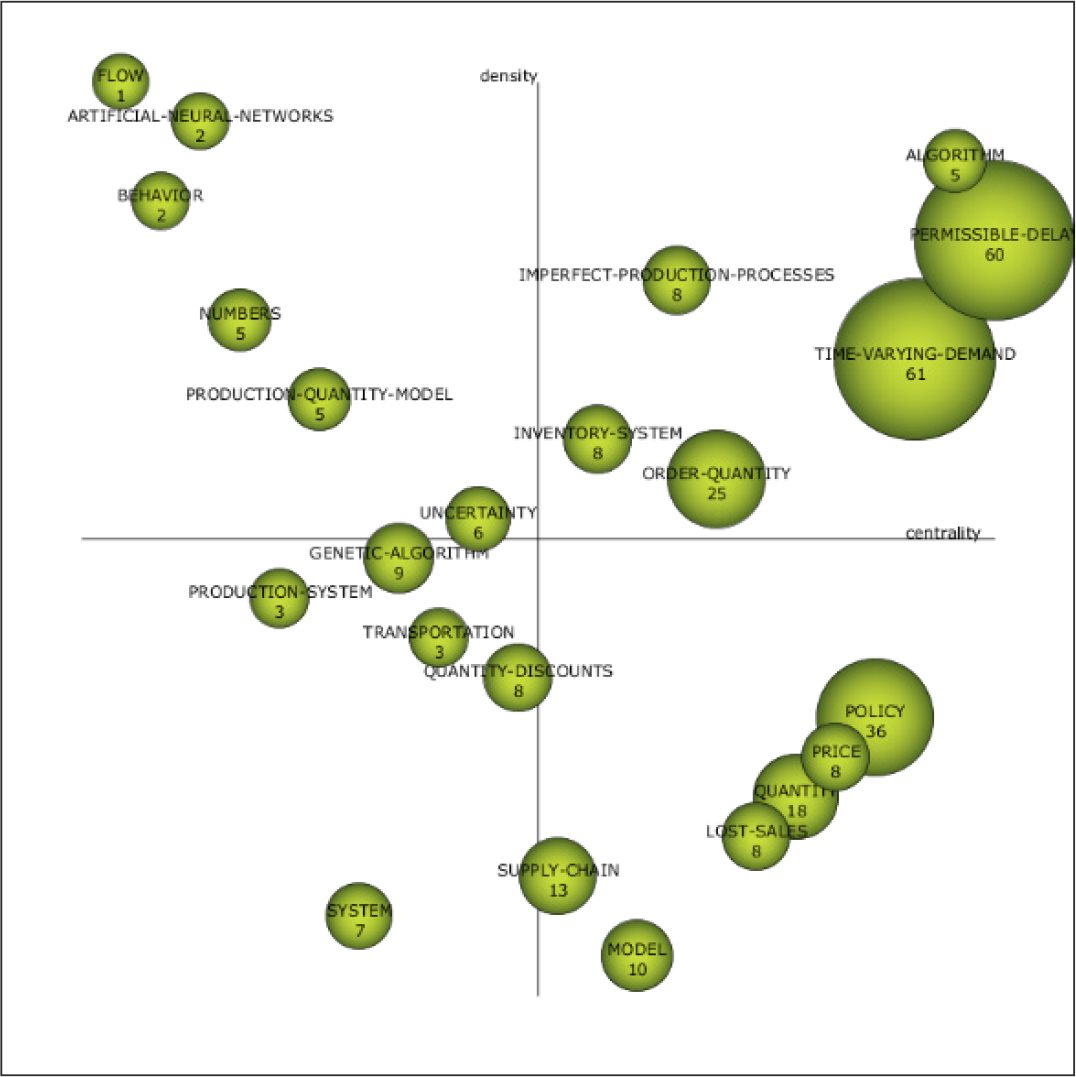
Figure 10:
A Strategic theme diagram during 2004-2008.
| Theme | Centrality | Density | Frequency of Document | h-index of Document | Citations of Document |
|---|---|---|---|---|---|
| Permissible-Delay | 76.59 | 40.28 | 60 | 31 | 3017 |
| Algorithm | 60.92 | 47.22 | 5 | 4 | 1734 |
| Imperfect- Production- Processes | 33.13 | 39.95 | 8 | 7 | 259 |
| Inventory-System | 27.79 | 19.71 | 8 | 5 | 184 |
| Production -Quantity- Model | 15.74 | 20.14 | 5 | 5 | 158 |
| Order-quantity | 33.38 | 13.1 | 25 | 14 | 634 |
| Time- Varying -Demand | 54.64 | 20.26 | 61 | 29 | 2567 |
| Numbers | 13.87 | 38.15 | 5 | 5 | 133 |
| Price | 39.86 | 5.45 | 8 | 7 | 300 |
| Genetic -Algorithm | 19.52 | 10.97 | 9 | 3 | 94 |
| Policy | 46.75 | 6.33 | 36 | 20 | 1873 |
| Uncertainty | 23.42 | 11.6 | 6 | 6 | 468 |
| System | 17.86 | 1.99 | 7 | 5 | 543 |
| Quantity- Discounts | 26.04 | 9.37 | 8 | 6 | 188 |
| Model | 27.91 | 1.59 | 10 | 5 | 207 |
| Quantity | 37.97 | 3.13 | 18 | 15 | 682 |
| Supply-Chain | 26.39 | 2.41 | 13 | 6 | 193 |
| Lost-Sales | 37.07 | 2.59 | 8 | 7 | 309 |
| Behavior | 3.81 | 42.22 | 2 | 2 | 118 |
| Artificial -Neural- Networks | 7.36 | 76.67 | 2 | 2 | 44 |
| Transportation | 20.56 | 9.44 | 3 | 3 | 67 |
| Production -System | 15.14 | 9.44 | 3 | 3 | 79 |
| Flow | 1.36 | 81.25 | 1 | 1 | 16 |
Although the theme “PERMISSIBLE-DELAY” has found itself with the highest centrality in the right quadrant and the theme “ALGORITHM” has found itself with the highest density value in the top-right quadrant, indicating that these themes have strong connections with other keywords in comparison to other themes.
During 2009-2013 total keywords have increased to 336 with a growth rate of 39.42% among the total 878 publication (augmented by 72.5%). It was discovered that there were only 13 themes over this time, and they were about evenly dispersed in terms of document frequency. During this period, the theme “PERMISSIBLE-DELAY” has the highest document frequency of 206. So, the theme “PERMISSIBLE-DELAY” was the most active theme. Although the theme “INVENTORY-MODEL” was active theme with a document frequency of 161(Figure 11, Table 2). The theme “PERMISSIBLE-DELAY” got the most document citations (8621), followed by “LANDSLIDE” with 5755 document citations. The theme ”PERMISSIBLE-DELAY” was found in the top-right quadrant with the highest centrality value, suggesting that it is the most significant and closely related theme to other keywords.
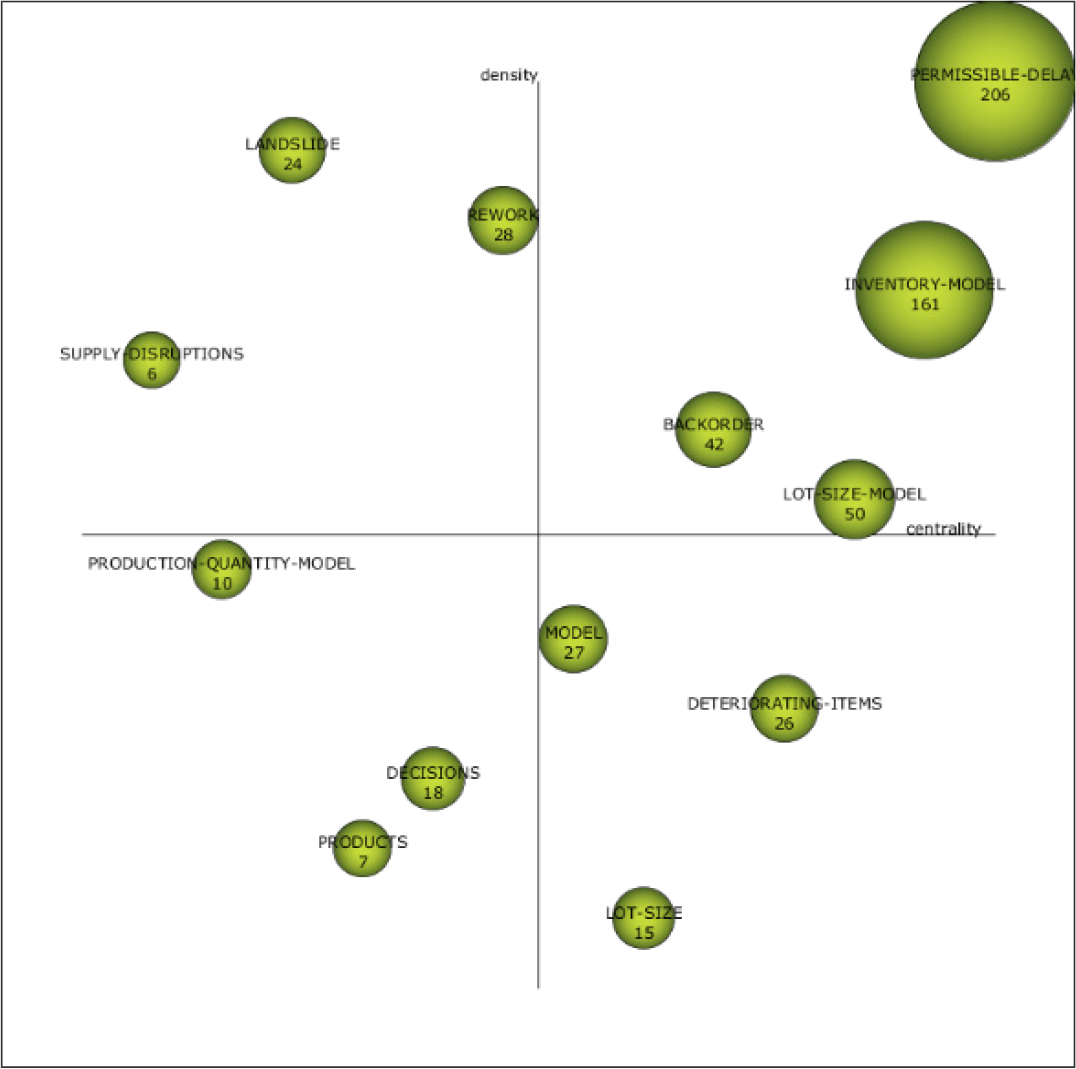
Figure 11:
A Strategic theme diagram during 2009-2013.
| Theme | Centrality | Density | Frequency
of Document |
h-index
of Document |
Citations
of Document |
|---|---|---|---|---|---|
| Permissible -Delay | 76.79 | 44.25 | 206 | 51 | 8621 |
| Landslide | 8.93 | 25.48 | 24 | 23 | 5755 |
| Inventory -Model | 59.77 | 7.85 | 161 | 45 | 5353 |
| Rework | 15.04 | 10.79 | 28 | 16 | 893 |
| Backorder | 25.27 | 6.75 | 42 | 20 | 1312 |
| Lot-Size- Model | 26.59 | 4.4 | 50 | 23 | 2337 |
| Model | 19.71 | 2.39 | 27 | 19 | 1121 |
| Deteriorating -Items | 26.31 | 2.14 | 26 | 18 | 1092 |
| Lot-Size | 23.15 | 1.49 | 15 | 13 | 701 |
| Decisions | 10.3 | 1.85 | 18 | 11 | 269 |
| Production -Quantity- Model | 4.79 | 2.81 | 10 | 9 | 391 |
| Products | 9.7 | 1.81 | 7 | 6 | 288 |
| Supply- Disruptions | 4.63 | 7.44 | 6 | 5 | 411 |
During 2014-2018, total keywords were increased to 392 with a growth rate of 16.67% among the total 1001 publications (augmented by 14.01%). During this period, the number of themes were found to have decreased to 9, these themes were more or less uniformly distributed document frequency. During this period the theme “EOQ-MODEL” was the most active with a document frequency of 310 followed by “DEMAND” with a document frequency of 147(Figure 12, Table 3). The theme “EOQ-MODEL” has received the most document citations(9892), followed by “LANDSLIDE” with 6728 documents citation, “DEMAND” with 3812 document citations and “SHORTAGES” with 1760 document citations. The theme “EOQ-MODEL” was found in top-right quadrant with highest centrality of 94.4. This demonstrated the theme’s highest relevance and its strong relationships with other theme-related keywords. The themes that came next were “REWORK” (centrality=23.42), “DEMAND” (centrality=29.54), and “DETERIORATING-ITEMS” (centrality=29.33). The theme “LANDSLIDE” was found in a too-left quadrant with a centrality of 16.07, so it was an isolated and developed theme. The theme “SHORTAGES” came under basic and transversal, as it was found in the bottom-right quadrant. The themes “UNCERTAINTY”, “LOT-SIZE” and “DEPENDENT-DEMAND” came under emerging focus, as they were found in bottom-left quadrant.
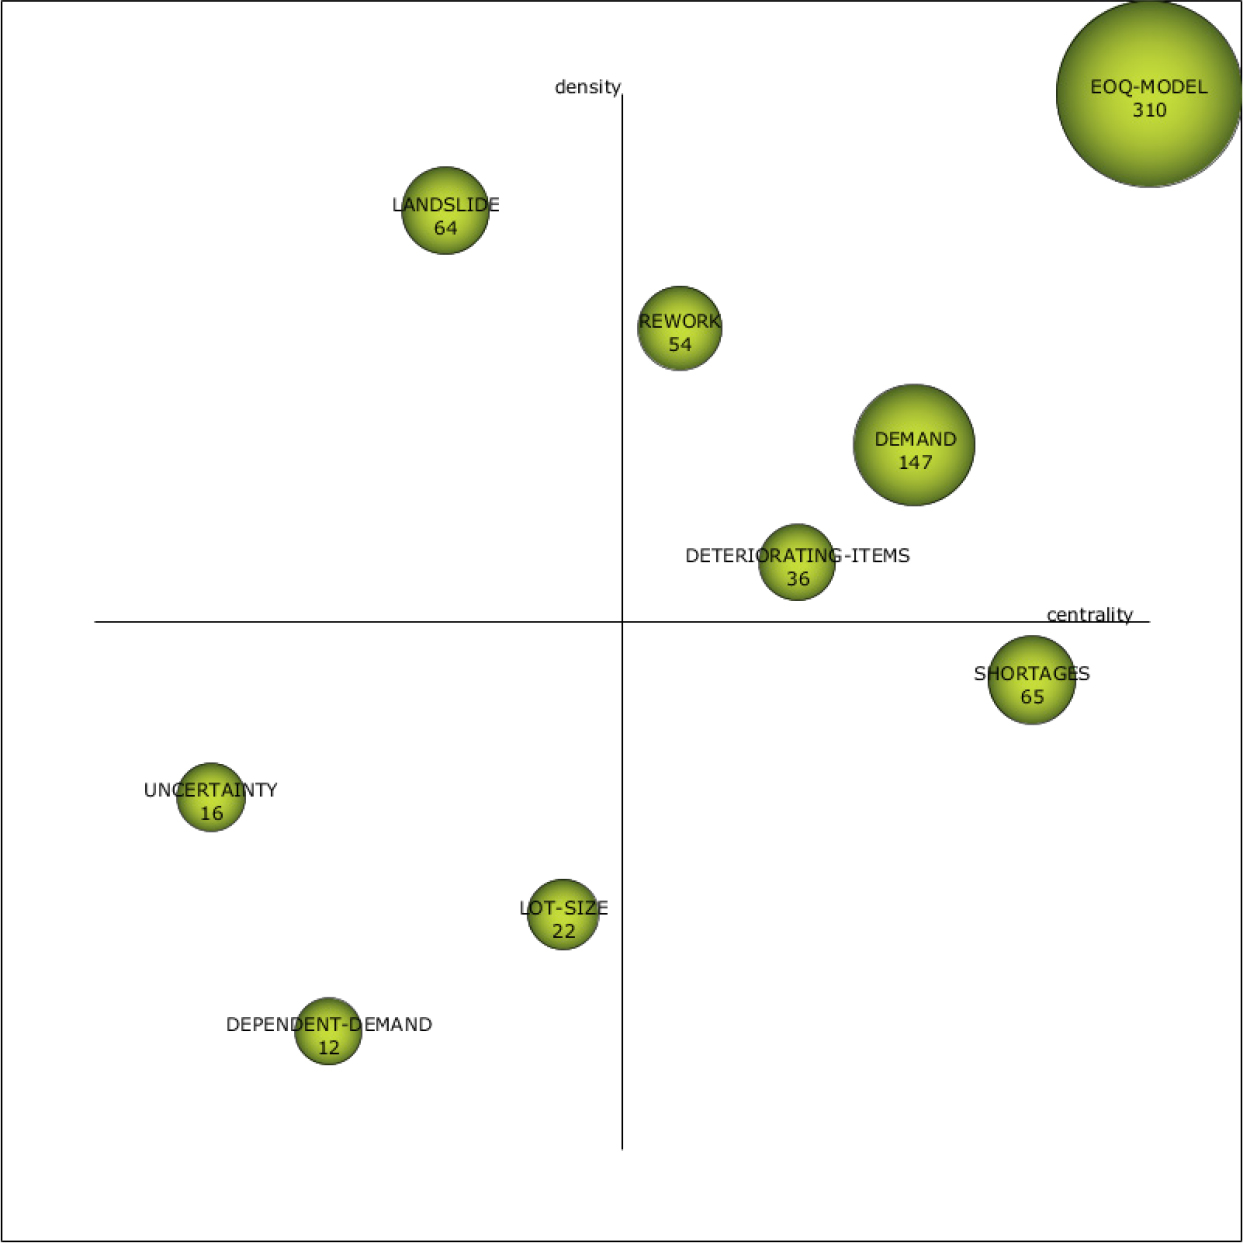
Figure 12:
A Strategic theme diagram during 2014-2018.
| Theme | Centrality | Density | Frequency
of Document |
h-index
of Document |
Citations
of Document |
|---|---|---|---|---|---|
| EOQ-model | 94.4 | 45.14 | 310 | 57 | 9892 |
| Landslide | 16.07 | 33.75 | 64 | 44 | 6728 |
| Rework | 23.42 | 10.66 | 54 | 21 | 1308 |
| Shortages | 34.5 | 5.14 | 65 | 26 | 1760 |
| Deteriorating-Items | 29.33 | 5.16 | 36 | 20 | 1394 |
| Demand | 29.54 | 6.42 | 147 | 36 | 3812 |
| Lot-size | 18.53 | 1.88 | 22 | 13 | 683 |
| Uncertainty | 6.03 | 1.89 | 16 | 13 | 949 |
| Dependent-Demand | 8.89 | 1.41 | 12 | 8 | 221 |
During the end period (2019-2023), the number of themes were found to 9, which was same as the previous period. But during this period, the number of keywords increased to 415, with a growth rate 5.867%.Thus the growth rate of keywords was lower than the all previous periods. Also during this period, the number of publications increased to 1122, with a growth rate of 12.09%.Thus the growth rate of publications was lower than the all previous periods. During this period the theme “EOQ-MODEL” was the most active with a document frequency of 372, followed by “DEMAND” with a document frequency of 92.The theme “EOQ-MODEL” has received the highest document citations (5106), followed by “HAZARD” with 1725 document citations and “DEMAND” with 1297 document citations (Figure 13, Table 4). The theme “EOQ-MODEL” was found in top-right quadrant with the highest centrality of 82.23. This showed that the theme was of the utmost importance and that it had strong relationships with other theme-related keywords. ”LOT-SIZE” came in second with a centrality of 23.48. The theme “SHORTAGES” was found in bottom-left with a centrality of 14.68, so by assigning this theme, it came under emerging focus. The themes “HAZARD”, “SUPPORT-VECTOR-MACHINE” and “CARBON-EMISSION” were found in the top-left quadrant with a centrality of 9.33, 8.89, and 11.98, respectively. So by assigning these themes, we created an isolated theme. The themes “DEMAND”, “TIME” and “SYSTEM” were found in the bottom-right quadrant with a centrality of 24.32,18.4, and 19.7, respectively. So these themes came under basic themes.
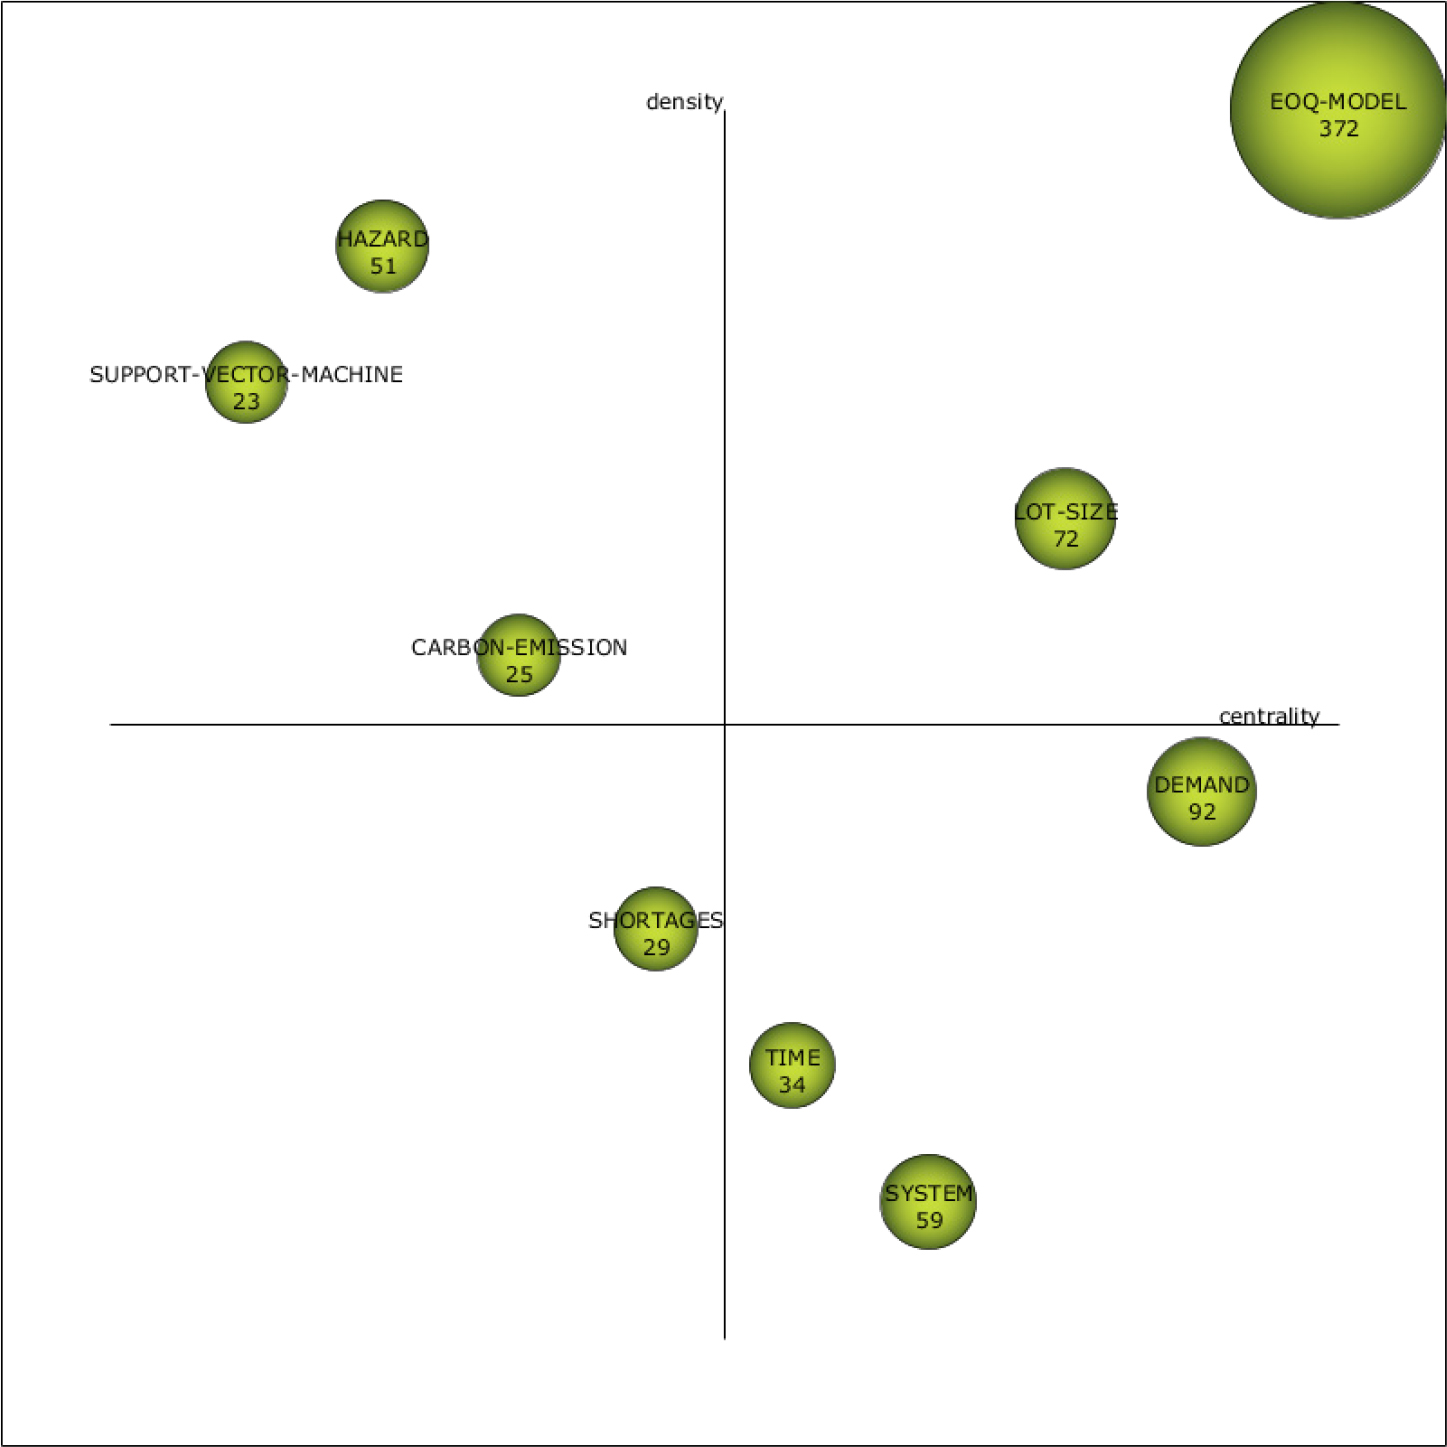
Figure 13:
A Strategic theme diagram during 2019-2023.
| Theme | Centrality | Density | Frequency
of Document |
h-index
of Document |
Citations
of Document |
|---|---|---|---|---|---|
| EOQ-model | 82.23 | 32.06 | 372 | 38 | 5106 |
| Hazard | 9.33 | 8.42 | 51 | 23 | 1725 |
| Demand | 24.32 | 2.89 | 92 | 21 | 1297 |
| Lot-size | 23.48 | 6.89 | 72 | 17 | 800 |
| Carbon-Emission | 11.98 | 6.54 | 25 | 9 | 408 |
| System | 19.7 | 1.73 | 59 | 16 | 772 |
| Shortages | 14.68 | 2.73 | 29 | 12 | 392 |
| Time | 18.4 | 1.95 | 34 | 14 | 538 |
| Support-Vector- Machine | 8.89 | 1.41 | 12 | 8 | 221 |
Evolution of keywords
The Figure 14 shows the quantitative evolution and interchange of keywords from the previous period to the next period for total publication. The amount of keywords that were used at that time is shown beneath each circle. The arrow showing how many keywords are coming freshly emerging keywords are indicated towards the circle.

Figure 14:
Keyword mapping that overlaps across time periods.
In the opposite direction, the outward-pointing arrow denotes the quantity of terms that remain unutilized throughout time. A arrow pointing from one period to the next signifies the integer value of the quantity of keywords transferred and the percentage of overlap in brackets (also known as the Similarity Index).The greater similarity index value suggests that primary themes are more or less constant, whereas the number of recently developed keywords shows how the central idea is developed in various sub-themes. With a CPGR of 19.86%, the number of keywords increased from 241 in the first period to 415 in the most recent one. The percentages of new keywords have been added to the worldwide percentages (40.18% during 2009-2013, 26.27% during 2014-2018, 18.07% during 2019-2023).
Thematic evolution
The Figure 15 represents the thematic evolution. For every period listed below its assigned column, a different theme was plotted in a column. The number of published documents linked to each theme cluster determines the size of the node representing that theme cluster. Links are used to connect themes that have a relationship between different periods. The Inclusion Index, which can be defined as the degree of commonly distributed keywords between two theme clusters, is directly correlated with the thickness of the link. While broken line links show theme clusters sharing keywords with topics that are not the main item, solid line links show the linked theme cluster sharing the main keywords with topics. Twenty one themes, including “PERMISSIBLE- DELAY”,“ALGORITHM”,“IMPERFECT-PRODUCTION-PROCESSES”, “INVENTORY-SYSTEM”, “PRODUCTION-QUANTITY-MODEL”,“ORDER-QUANTITY”,“TIME- VARYING-DEMAND”,“NUMBERS”,“PRICE”,“GENETIC ALGORITHM”,“POLICY”,“UNCERTAINTY”,“SYSTEM”, “QUANTITY-DISCOUNTS”,“MODEL”,“QUANTITY”, “SUPPLY-CHAIN”,“LOST-SALES”,“ ARTIFICIAL-NEURAL-NETWORKS”, “TRANSPORTATION” and “PRODUCTION-SYSTEM” have a strong connection to the themes of the following period, indicating the persistence of the associated keywords in relation to topics. Among these themes, only three “PERMISSIBLE-DELAY”, “PRODUCTION-QUANTITY-MODEL” and “MODEL” have surfaced in the subsequent time frame. The themes “PERMISSIBLE-DELAY”,“LANDSLIDE”,“INVENTORY- MODEL”,“REWORK”,“BACKORDER”,“MODEL”,“DETERIORATING- ITEMS”,“LOT-SIZE”,“DECISIONS”,“PRODUCTION-QUANTITY- MODEL” and “SUPPLY-DISRUPTIONS” served as transitional themes that shared the main topics between 2009 and 2013.Fix themes “LANDSLIDE”,“REWORK”,“DETERIORATING-ITEMS” and “LOT-SIZE” served as thematic link between those who received topics from the previous period and those who shared the main topics of the next period from 2014 to 2018.During the end period, “EOQ-MODEL” has emerged as the primary topic followed by “DEMAND” and “LOT-SIZE”. During 2014-2018, some themes have transformed into new themes during 2019-2023 namely, “HAZARD”, “CARBON-EMISSION”, “SYSTEM”, “TIME” and “SUPPORT-VECTOR-MACHINE”.
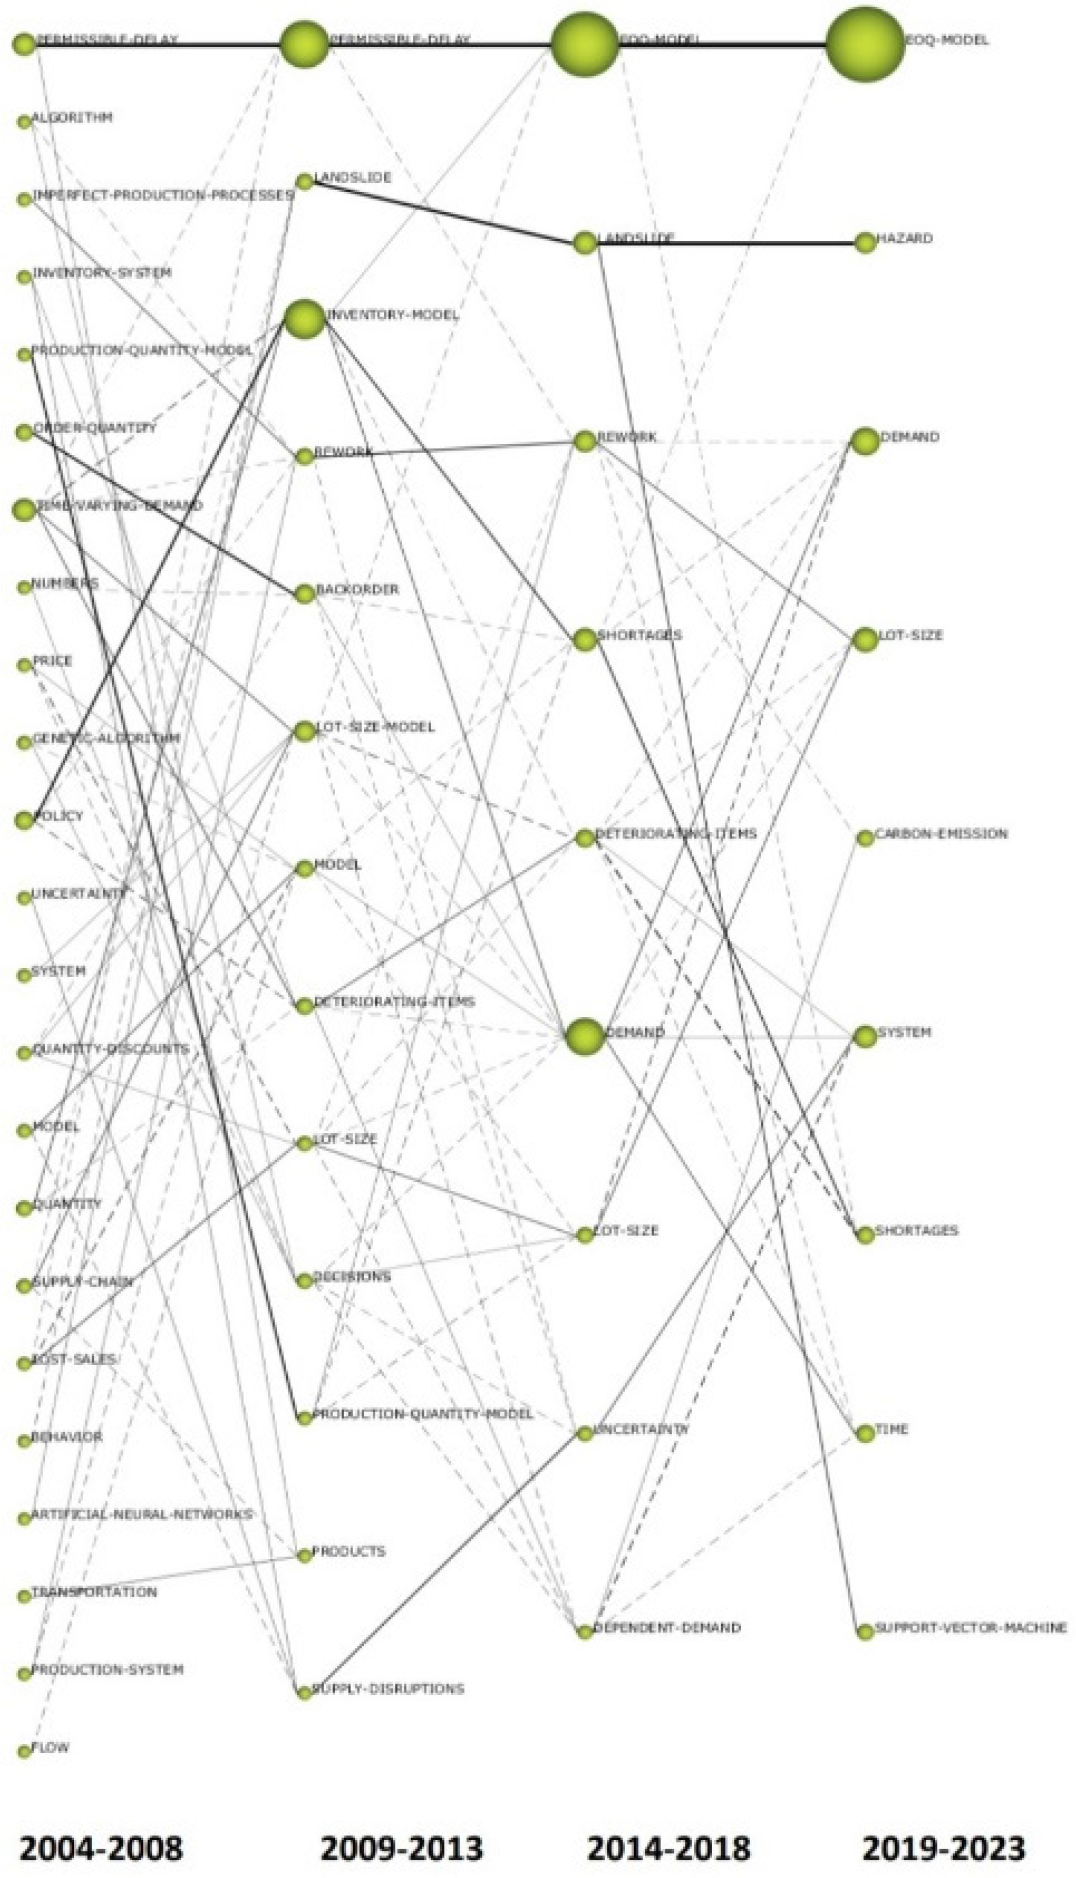
Figure 15:
Evolution map of keyword’s during successive periods.
Continuity of themes
The distribution of themes from 2004-2008 to 2019-2023 is represented in Figure 15. The distribution and trend of carryover indicate a tendency toward theme continuity. Most of the themes have combined to form new themes that were previously distinct. During the first period and 2009-2013 period, “PERMISSIBLE-DELAY” was the dominant theme. A equivalent pattern was also noted in relation to “PRODUCTION-QUANTITY-MODEL” and “MODEL”. During 2009-2013 period and 2014-2018, “LANDSLIDE” was the highly developed and isolated theme. During 2014-2018 period and 2019-2023 period, “EOQ-MODEL” was the dominant theme. The continuous themes are “REWORK”, “DETERIORATING-ITEMS” and “LOT-SIZE” from during 2009-2013 period to 2014-2018 period. Again, the continuous themes are “SHORTAGES”, “LOT-SIZE” and “DEMAND” from during 2014-2018 period to 2019-2023 period.
Sifting of different important themes at successive periods
During the first period and 2009-2013 period, “PERMISSIBLE-DELAY” was the dominant theme. In light of inflation, allowable payment delays, and customer returns, a top cited paper developed an economic ordering policy model for non-instantaneously deteriorating items with selling demand driven by price and inflation in the first period (Ghoreishi et al., 2015). During the period 2009-2013, “PERMISSIBLE-DELAY” was positioned in same dominant theme. An EPQ type inventory model with planned backorders was developed in a highly cited paper between 2009 and 2013 to determine the economic production quantity for a single product (C´ardenas-Barr´on, 2009).
During the period 2004-2008, the “PRODUCTION-QUANTITY-MODEL” was positioned in “highly developed and isolated themes”. During this time, a top cited paper established practical necessity and possibility constraints within the framework of a multi-item dynamic production-inventory control system (Maity and Maiti, 2007). During the period 2009-2013, the “PRODUCTION-QUANTITY-MODEL” was sifted in “emerging themes”. In this period, A two-warehouse inventory model with imperfect quality production processes (Chung et al., 2009) was established in a top cited paper. During the first period and 2009-2013 period, “MODEL” was “basic and transversal theme”. In the first period, the topic of figuring out the economic order quantity in the context of a reasonable payment delay was covered in a top cited paper (Chung et al., 2005). During 2009-2013 period, “MODEL” was positioned in the same “basic and transversal themes”. In this period, a case from the Tinau watershed in west Nepal was examined using the “analytical hierarchy process (AHP)” for mapping the vulnerability to landslides (Kayastha et al., 2013) in a top cited paper.
During the period 2009-2013, the “DETERIORATING-ITEMS” was positioned in basic and transerval themes. During this time, a top cited paper examined an inventory model that included a general ramp type demand rate, a time-dependent deterioration rate, and partial backlog of unmet demand (Skouri et al., 2009). During the period 2014-2018, the “DETERIORATING-ITEMS” was sifted in “motor themes”. In this period, a top citation paper presented an EOQ model for the retailer and deteriorating items have expiration dates in addition to continuously deteriorating (Wu et al., 2014).
During the period 2009-2013 and during 2014-2018 period “LANDSLIDE” was “highly developed and isolated theme”. In 2009-2013 period, a top cited paper compared “the prediction performances of three different approaches such as decision tree (DT), Support Vector Machine (SVM) and adaptive neuro-fuzzy inference system (ANFIS) for landslide susceptibility mapping at Penang Hill area, Malaysia” using GIS (Pradhan, 2013). In 2014-2018 period, a top cited paper used “three state-of-the-art data mining techniques, namely, Logistic Model Tree (LMT), Random Forest (RF), and Classification and Regression Tree (CART) models,” to map the vulnerability to landslides (Chen et al., 2017). During the period 2009-2013, “REWORK” was “highly developed and isolated theme”. In this period, production, remanufacture and waste disposal model with lost sales (Jaber and El Saadany, 2009) was established in a top cited paper. During the period 2014-2018, “REWORK” was sifted in “motor themes”. A top cited paper from this era developed an EPQ model for a single-stage production system that included a random defective rate, rework process, and backorders (Sarkar et al., 2014).
During the period 2009-2013, “LOT-SIZE” was the “basic and transversal theme”. In this period, a top cited paper established an EOQ model with time-varying deterioration rate and payment delay (Sarkar, 2012). During the period 2014-2018, “LOT-SIZE” was sifted in “emerging themes”. In this period, a top cited paper established inventory models using discounted cash flow analysis for deteriorating items with maximum lifespan under downstream partial trade credits to credit-risk customers (Wu et al., 2016).
During the period 2019-2023, “LOT-SIZE” was sifted in “motor themes”. In this period, a top cited paper established inventory models for perishable goods with advanced payment, linearly time-dependent holding costs, and demand dependent on advertising and selling price (Khan et al., 2020).
During 2014-2018 period and 2019-2023 period, “EOQ-MODEL” was the “dominant theme”. In the period 2014-2018,a novel model was put forth that considers the relationship between total carbon emissions, inventory policies (EOQ), and demand that is dependent on price and the environment (Hovelaque and Bironneau, 2015) in a top cited paper. In the period 2019-2023, “multi-product and bi-objective EPQ models with defective products and optimal lot-sizing of the replenishments in constrained” were optimized by Generalised cross decomposition (Gharaei et al., 2020) in a top cited paper.
During 2014-2018 period, “DEMAND” was the “motor theme”. In this period, an inventory model was established on the changing potentially suitable areas for agriculture under changing climate conditions (Zabel et al., 2014) in a top cited paper. During 2019-2023 period, “DEMAND” was sifted in “basic and transversal themes”. In this period, a mathematical model was created taking into account the suggested RFID-based recovery channel’s design and implementation costs (Ullah and Sarkar, 2020) in a top cited paper.
During 2014-2018 period, “SHORTAGES” was the “basic and transversal theme”. In this period, an inventory model for deteriorating items under a two-level partial trade credits in supply chain with allowable shortages (Tiwari et al., 2018) was developed in a top cited paper. During 2019-2023 period, “SHORTAGES” was sifted in “emerging themes”. In this period, “quality control and green production policies” were taken into consideration when designing a bi-objective, multi-product, constrained, integrated EPQ model (Gharaei et al., 2021) in a top cited paper.
During the first period, “UNCERTAINTY” was the “highly developed and isolated theme”. In this period, a top cited paper presented a multi-stage, multi-period, and multi-product scheduling model to address multiple incommensurable goals for a multi-echelon supply chain network with erratic product prices and market demands (Chen and Lee, 2004). During 2014-2018 period, “UNCERTAINTY” was sifted in “emerging themes”. In this period, a mathematical model that took into account global factors like exchange rates and customs duties was presented for a closed-loop supply chain network (Amin and Baki, 2017) in a top cited paper.
CONCLUSION
This study looked at the quantitative and qualitative output of research on inventory models in a fuzzy environment from 2004 to 2023. Over the past ten years, the performance of research on inventory models in a fuzzy environment has accelerated at a higher CPGR, according to a thorough analysis of bibliometric parameters. This study identified the impact of citations of top most 10 countries considering the quantity of publications. It will be useful to know the top 20 journals in order to identify journals for research communication and to plan future research. Furthermore, the theme evolution analysis that was conducted over successive periods revealed the fortitudes and weaknesses in this area. Research advancement has been hampered by greatest degree of disconnection and lowest degree of linkages between research themes. The following recent research themes are suggested by this analysis: “CARBON-EMISSION” and “HAZARD”. In order for these themes to grow into significant themes for upcoming development in this field of study, they must be addressed.
Cite this article:
Ray P, Dey A, Mallik A, Seal S. Inventory Management through Economic Order Quantity Model: A Bibliometric and Scientometric Analysis. Info Res Com. 2025;2(2):225-40.
ABBREVIATIONS
| EOQ | Economic Order Quantity |
|---|---|
| EPQ | Economic Production Quantity |
| WoS | Web of Science |
| ACPP | Average Citation per Publication |
| CPGR | Compound Period-wise Growth Rate. |
References
- Agarwal S.. (2014) Economic order quantity model: a review. VSRD International Journal of Mechanical, Civil, Automobile and Production Engineering 4: 233-236 Google Scholar
- Alfares H. K., Ghaithan A. M.. (2019) Eoq and epq production-inventory models with variable holding cost: state-of-the-art review. Arabian Journal for Science and Engineering 44: 1737-1755 Google Scholar
- Amin S. H., Baki F.. (2017) A facility location model for global closed-loop supply chain network design. Applied Mathematical Modelling 41: 316-330 Google Scholar
- Bhaya S., Pal M., Nayak P. K.. (2014) Intuitionistic fuzzy optimization technique in eoq model with two types of imperfect quality items. Advanced Modeling and Optimization 16: 33-50 Google Scholar
- Bj¨ork K.-M.. (2009) An analytical solution to a fuzzy economic order quantity problem. International journal of approximate reasoning 50: 485-493 Google Scholar
- C´ardenas-Barr´on L. E.. (2009) Economic production quantity with rework process at a single-stage manufacturing system with planned backorders. Computers and Industrial Engineering 57: 1105-1113 Google Scholar
- Chakrabortty S., Pal M., Nayak P. K.. (2013) Intuitionistic fuzzy optimization technique for pareto optimal solution of manufacturing inventory models with shortages. European Journal of Operational Research 228: 381-387 Google Scholar
- Chen C.-L., Lee W.-C.. (2004) Multi-objective optimization of multi-echelon supply chain networks with uncertain product demands and prices. Computers and Chemical Engineering 28: 1131-1144 Google Scholar
- Chen W., Xie X., Wang J., Pradhan B., Hong H., Bui D. T., Duan Z., Ma J., et al. (2017) A comparative study of logistic model tree, random forest, and classification and regression tree models for spatial prediction of landslide susceptibility. Catena 151: 147-160 Google Scholar
- Cheng T.. (1989) An economic production quantity model with flexibility and reliability considerations. European Journal of Operational Research 39: 174-179 Google Scholar
- Chung K.-J., Goyal S. K., Huang Y.-F.. (2005) The optimal inventory policies under permissible delay in payments depending on the ordering quantity. International Journal of production economics 95: 203-213 Google Scholar
- Chung K.-J., Her C.-C., Lin S.-D.. (2009) A two-warehouse inventory model with imperfect quality production processes. Computers and Industrial Engineering 56: 193-197 Google Scholar
- Cobo M. J., L´opez-Herrera A. G., Herrera-Viedma E., Herrera F.. (2012) Scimat: A new science mapping analysis software tool. Journal of the American Society for information Science and Technology 63: 1609-1630 Google Scholar
- De S. K., Beg I.. (2016) Triangular dense fuzzy sets and new defuzzification methods. Journal of Intelligent and Fuzzy systems 31: 469-477 Google Scholar
- De S. K., Goswami A., Sana S. S.. (2014) An interpolating by pass to pareto optimality in intuitionistic fuzzy technique for a eoq model with time sensitive backlogging. Applied Mathematics and Computation 230: 664-674 Google Scholar
- De S. K., Mahata G. C.. (2017) Decision of a fuzzy inventory with fuzzy backorder model under cloudy fuzzy demand rate. International Journal of Applied and computational mathematics 3: 2593-2609 Google Scholar
- De S. K., Mahata G. C.. (2019) A cloudy fuzzy economic order quantity model for imperfect-quality items with allowable proportionate discounts. Journal of Industrial Engineering International 15: 571-583 Google Scholar
- Gharaei A., Hoseini Shekarabi S. A., Karimi M.. (2020) Modelling and optimal lot-sizing of the replenishments in constrained, multi-product and bi-objective epq models with defective products: Generalised cross decomposition. International Journal of Systems Science: Operations and Logistics 7: 262-274 Google Scholar
- Gharaei A., Hoseini Shekarabi S. A., Karimi M., Pourjavad E., Amjadian A.. (2021) An integrated stochastic epq model under quality and green policies: generalised cross decomposition under the separability approach. International Journal of Systems Science: Operations and Logistics 8: 119-131 Google Scholar
- Ghoreishi M., Weber G.-W., Mirzazadeh A.. (2015) An inventory model for non-instantaneous deteriorating items with partial backlogging, permissible delay in payments, inflation-and selling price-dependent demand and customer returns. Annals of Operations Research 226: 221-238 Google Scholar
- Ghosh B., Dutta S. P., Mallik A.. (2020) Evolving trends of indian research performance in cryptography: A bibliometric and computational investigation. J. Sci. Res 9: 253-267 Google Scholar
- Hamers L. (1989) Similarity measures in scientometric research: The jaccard index versus salton’s cosine formula. Information Processing and Management 25: 315-18 Google Scholar
- Hovelaque V., Bironneau L.. (2015) The carbon-constrained eoq model with carbon emission dependent demand. International Journal of Production Economics 164: 285-291 Google Scholar
- Jaber M., Goyal S., Imran M.. (2008) Economic production quantity model for items with imperfect quality subject to learning effects. International Journal of Production Economics 115: 143-150 Google Scholar
- Jaber M. Y., El Saadany A. M.. (2009) The production, remanufacture and waste disposal model with lost sales. International Journal of Production Economics 120: 115-124 Google Scholar
- Kayastha P., Dhital M. R., De Smedt F.. (2013) Application of the analytical hierarchy process (ahp) for landslide susceptibility mapping: A case study from the tinau watershed, west nepal. Computers and Geosciences 52: 398-408 Google Scholar
- Khan M., Jaber M., Guiffrida A., Zolfaghari S.. (2011) A review of the extensions of a modified eoq model for imperfect quality items. International Journal of Production Economics 132: 1-12 Google Scholar
- Khan M. A.-A., Shaikh A. A., Konstantaras I., Bhunia A. K., C´ardenas-Barr´on L. E.. (2020) Inventory models for perishable items with advanced payment, linearly time-dependent holding cost and demand dependent on advertisement and selling price. International Journal of Production Economics 230: 107804. Google Scholar
- Kumar R. S.. (2018) Modelling a type-2 fuzzy inventory system considering items with imperfect quality and shortage backlogging. S¯adhan¯a 43: 1-10 Google Scholar
- Li Y.. (2019) Modeling multi-item inventory problem under type-2 fuzzy demand. IFAC-PapersOnLine 52: 147-152 Google Scholar
- Maiti A. K.. (2021) Cloudy fuzzy inventory model under imperfect production process with demand dependent production rate. Journal of Management Analytics 8: 741-763 Google Scholar
- Maity K., Maiti M.. (2007) Possibility and necessity constraints and their defuzzification-a multi-item production-inventory scenario via optimal control theory. European Journal of Operational Research 177: 882-896 Google Scholar
- Maity S., Chakraborty A., De S. K., Mondal S. P., Alam S.. (2020) A comprehensive study of a backlogging eoq model with nonlinear heptagonal dense fuzzy environment. RAIRO-operations research 54: 267-286 Google Scholar
- Maity S., Chakraborty A., De S. K., Pal M.. (2023) A study of an eoq model of green items with the effect of carbon emission under pentagonal intuitionistic dense fuzzy environment. Soft Computing 27: 15033-15055 Google Scholar
- Maity S., De S. K., Pal M., Mondal S. P.. (2021) A study of an eoq model of growing items with parabolic dense fuzzy lock demand rate. Applied System Innovation 4: 81. Google Scholar
- Mittal M., Jain V., Pandey J. T., Jain M., Dem H.. (2023) Optimizing inventory management: A comprehensive analysis of models integrating diverse fuzzy demand functions. Mathematics 12: 70. Google Scholar
- Mondal B., Garai A., Roy T. K.. (2018) Optimization of eoq model with space constraint: An intuitionistic fuzzy geometric programming approach. Notes Inst Fuzzy Sets 24: 172-189 Google Scholar
- Pradhan B.. (2013) A comparative study on the predictive ability of the decision tree, support vector machine and neuro-fuzzy models in landslide susceptibility mapping using gis. Computers and Geosciences 51: 350-365 Google Scholar
- Sahoo S., Acharya M., Patnaik S.. (2022) Sustainable intuitionistic fuzzy inventory models with preservation technology investment and shortages. International Journal of Reasoning-based Intelligent Systems 14: 8-18 Google Scholar
- Sarkar B.. (2012) An eoq model with delay in payments and time varying deterioration rate. Mathematical and Computer Modelling 55: 367-377 Google Scholar
- Sarkar B., C´ardenas-Barr´on L. E., Sarkar M., Singgih M. L.. (2014) An economic production quantity model with random defective rate, rework process and backorders for a single stage production system. Journal of Manufacturing Systems 33: 423-435 Google Scholar
- Senthilnathan S.. (2019) Economic order quantity (eoq). Google Scholar
- Shah N. H., Patel M.. (2022) An eoq model for deteriorating items when demand is cloud fuzzy. International Journal of Logistics Systems and Management 42: 140-152 Google Scholar
- Skouri K., Konstantaras I., Papachristos S., Ganas I.. (2009) Inventory models with ramp type demand rate, partial backlogging and weibull deterioration rate. European journal of operational research 192: 79-92 Google Scholar
- Tijssen R., Van Raan A.. (1989) Mapping co-word structures: A comparison of multidimensional scaling and leximappe. Scientometrics 15: 283-295 Google Scholar
- Tiwari S., C´ardenas-Barr´on L. E., Goh M., Shaikh A. A.. (2018) Joint pricing and inventory model for deteriorating items with expiration dates and partial backlogging under two-level partial trade credits in supply chain. International Journal of Production Economics 200: 16-36 Google Scholar
- Ullah M., Sarkar B.. (2020) Recovery-channel selection in a hybrid manufacturing-remanufacturing production model with rfid and product quality. International Journal of Production Economics 219: 360-374 Google Scholar
- Wu J., Al-Khateeb F. B., Teng J.-T., C´ardenas-Barr´on L. E.. (2016) Inventory models for deteriorating items with maximum lifetime under downstream partial trade credits to credit-risk customers by discounted cash-flow analysis. International Journal of Production Economics 171: 105-115 Google Scholar
- Wu J., Ouyang L.-Y., C´ardenas-Barr´on L. E., Goyal S. K.. (2014) Optimal credit period and lot size for deteriorating items with expiration dates under two-level trade credit financing. European Journal of Operational Research 237: 898-908 Google Scholar
- Zabel F., Putzenlechner B., Mauser W.. (2014) Global agricultural land resources–a high resolution suitability evaluation and its perspectives until 2100 under climate change conditions. PloS one 9: e107522. Google Scholar

